
Preventive Care in Nursing and Midwifery Journal

Volume 15, Issue 4 (10-2025)
Prev Care Nurs Midwifery J 2025, 15(4): 70-84 |
Back to browse issues page


Ethics code: non


Download citation:
BibTeX | RIS | EndNote | Medlars | ProCite | Reference Manager | RefWorks
Send citation to:


BibTeX | RIS | EndNote | Medlars | ProCite | Reference Manager | RefWorks
Send citation to:
Masaebi F, Maleki A, Farahmandkia Z. Trends in Maternal Mortality, Incidence and DALY Rates Associated with Abortion and Miscarriage Across SDI Levels: Insights from the GBD 2021 Dataset. Prev Care Nurs Midwifery J 2025; 15 (4) :70-84
URL: http://nmcjournal.zums.ac.ir/article-1-1014-en.html
URL: http://nmcjournal.zums.ac.ir/article-1-1014-en.html

Social Determinants of Health Research Center, Health and Metabolic Diseases Research Institute, Zanjan University of Medical Sciences, Zanjan, Iran , malekia41@yahoo.com
Full-Text [PDF 1699 kb]
(217 Downloads)
| Abstract (HTML) (593 Views)
y i = B 0 + B 1 t i + k =1 K γ k ( t i - τ k ) + + ε i
wheret i y i τ k B 0 B 1 γ k ε i ( t i - τ k ) + t i - τ k t i τ k
APC =100×[ ( β 1 + j =1 k γ j ) -1]
Moreover, the Average Annual Percent Change (AAPC) was derived as a weighted average of the APC values, with the segment lengths serving as weights. The statistical significance of APC and AAPC estimates was evaluated using 95% confidence intervals. Join point regression analysis was conducted using Joinpoint Regression Software version 4.8.0.1
Result
This secondary analysis of publicly available GBD data presents global and SDI‑stratified trends in the incidence, MMR, and DALY burden due to maternal abortion and miscarriage from 1990 to 2021. All rates are age‑standardized unless otherwise noted, and uncertainty is expressed as 95% uncertainty intervals (UI). Descriptive statistics for DALY, MMR, and incidence rates at selected time points are shown in Table 1, and their overall temporal patterns are illustrated in Figure 1. Globally, all three indicators declined between 1990 and 2021. The DALY rate decreased from 104.39 to 25.73 per 100 000, the MMR from 36.07 to 12.92 per 100 000, and the incidence rate from 1603.84 to 1001.64 per 100 000. The magnitude of decline varied substantially across SDI groups. In 2021, the DALY and MMR rates in low‑SDI countries were more than 100‑fold higher than those in high‑SDI countries (DALY: 113.27 vs. 0.75 per 100 000; MMR: 28.49 vs. 0.25 per 100 000). Incidence rates also remained disproportionately high in low‑SDI regions (1715.09 per 100 000 in 2021).
Table 1. Descriptive statistics for age-standardized and age-specific (15-49 years) DALY, maternal mortality and incidence rates per 100,000 from 1990 to 2021 by SDI level.
Table 2. Results of the Joinpoint Regression Models for Trends in Age-Standardized DALY, Maternal Mortality Ratio, and Incidence by SDI Groups (1990–2021)
* Indicates that the APC is significantly different from zero
Joinpoint regression results
Joinpoint regression was used to identify changes in trend direction. Table 3 summarizes the APC and AAPC for the global population. The sharpest annual decline in DALY rates occurred between 1999‑2002 (APC = ‑5.96%, 95% UI: ‑6.31, ‑5.02), while MMR fell most rapidly during the same interval (APC = ‑4.88%, 95% UI: ‑5.21, ‑1.01). For incidence, the largest reduction was observed in 1990‑1994 (APC = ‑2.32%, 95% UI: ‑2.39, ‑2.24). The overall downward trend was confirmed by statistically significant AAPCs: DALY (‑4.41%, 95% UI: ‑4.45, ‑4.37), MMR (‑3.24%, 95% UI: ‑3.31, ‑3.19), and incidence (‑1.50%, 95% UI: ‑1.51, ‑1.49).
Age‑specific analysis (women aged 15–49 years)
Because maternal health risks concentrate in the reproductive‑age group, we also examined trends among women aged 15–49 years. In this subgroup, DALY rates decreased from 208.50 to 50.88 per 100 000, MMR from 35.53 to 12.72 per 100 000, and incidence from 3507.81 to 1976.32 per 100 000. Disparities across SDI levels remained pronounced in 2021: DALY and MMR rates in low‑SDI countries were more than 8‑fold higher than in high‑SDI countries (DALY: 218.64 vs. 1.48; MMR: 28.11 vs. 0.25 per 100 000), and incidence was nearly four‑fold higher (3697.07 vs. 961.68 per 100 000).
Joinpoint regression for this age group (Table 4) showed significant reductions in all three indicators across every SDI stratum. The fastest long‑term DALY decline occurred in high‑middle‑SDI (AAPC = ‑6.33%, 95% UI: ‑6.38, ‑6.25) and low‑middle‑SDI countries (AAPC = ‑6.28%, 95% UI: ‑6.38, ‑6.22). For MMR, the largest AAPC was observed in high‑middle‑SDI regions (‑5.78%, 95% UI: ‑5.89, ‑5.69). Incidence declines were more modest, with the highest AAPC in high‑SDI countries (‑2.52%, 95% UI: ‑2.59, ‑2.45) and the lowest in low‑SDI countries (‑1.25%, 95% UI: ‑1.26, ‑1.24). Periods of stagnation or minimal change were present in several SDI groups, most consistently in low‑SDI countries.
Discussion
This study provides a comprehensive assessment of long‑term trends in maternal mortality and disability related to abortion and miscarriage, based on GBD 2021 estimates. Overall, the observed downward trends indicate meaningful global progress in maternal health over the past three decades. Despite these encouraging trends, the findings underscore persistent and unequal burdens across socio‑demographic contexts. Women of reproductive age (15-49 years) continue to experience a disproportionately higher burden, highlighting the critical importance of focused reproductive and maternal health services for this group. From a midwifery and nursing perspective, this emphasizes the ongoing need for comprehensive antenatal, post‑abortion, and miscarriage care, including early risk identification, timely referral, and continuity of care across the reproductive life course.
These findings showed that countries have made significant progress toward achieving the Millennium Development Goals (MDGs) in reducing maternal mortality associated with Abortion and Miscarriage. However, they have not yet fully met the Sustainable Development Goals (SDGs). The decline in MMR associated with Abortion and Miscarriage has been particularly notable in low-SDI countries, but the slower reduction in recent years highlights the need for greater focus on effective interventions, strengthening healthcare systems, and improving access to safe pregnancy and childbirth services.
Maternal mortality arises from both direct and indirect causes. Direct causes include postpartum hemorrhage, hypertensive disorders during pregnancy, sepsis, and complications from unsafe abortion. Indirect causes stem from pre-existing health conditions such as HIV, malaria, and cardiovascular diseases [18]. In high-income nations, leading direct causes of maternal death include embolism, sepsis, and hemorrhage, while indirect causes such as cardiac diseases and, more recently, COVID-19, have also been significant contributors [19-21].
The GBD 2017 study reported a decline in age‑standardized incidence rates and DALYs for maternal disorders, with the highest burden observed in low‑ and middle‑income countries, particularly sub‑Saharan Africa. Although abortion and miscarriage had the highest incidence, maternal hemorrhage remained the leading contributor to disease burden, followed by hypertensive and indirect maternal disorders. Despite a slight increase in total cases, the overall maternal disease burden declined, especially in lower‑income regions. Consistent with these findings, the present study demonstrates a significant reduction in maternal mortality and DALY rates over time; however, the recent slowing of progress highlights persistent challenges in achieving the SDGs and underscores the need for sustained maternal health interventions in low‑ and middle‑income settings. [3]. Overall improvements in maternal mortality and DALY rates appear to reflect enhanced access to family planning and contraception, safer abortion services, and strengthened maternal health systems, supported by policy‑driven interventions and global health initiatives. The expansion of skilled birth attendance, broader antenatal and postnatal care coverage, improved emergency obstetric services, and increased public awareness through education and health campaigns have collectively contributed to these favorable trends [22]. Our results showed that the stratified analysis by Socio‑Demographic Index further reveals substantial global inequities. High‑SDI countries consistently demonstrate the lowest burden, likely reflecting robust health systems, legal and safe abortion services, and well‑established midwifery‑led models of care. In contrast, although low‑SDI countries have achieved notable reductions over time, they still bear the highest absolute burden. This pattern aligns with previous GBD reports and underscores the vulnerability of maternal health services in resource‑constrained settings, where shortages of skilled birth attendants, limited access to emergency obstetric care, and sociocultural barriers remain significant challenges [3, 19].
Importantly, the recent slowing of progress in maternal mortality reduction suggests that earlier gains may be reaching a plateau. This trend has critical implications for policy and practice, particularly in low‑SDI countries, where sustaining progress will require renewed investment in midwifery workforce development, strengthening primary health care, and integrating reproductive health services with broader social and health policies. Nurses and midwives play a central role in these efforts, as frontline providers in counseling, prevention of unsafe abortion, management of complications, and advocacy for women’s reproductive rights.
Wei’s GBD 2021 analysis shows a sustained decline in MMR from 1990 to 2021 in high‑SDI regions, while low‑SDI countries continue to bear a disproportionately high maternal mortality burden. Maternal hemorrhage and hypertensive disorders remain the leading causes of death, with notable regional variations, including higher abortion‑related complications in high‑SDI regions and a substantial contribution of HIV/AIDS and other indirect causes in sub‑Saharan Africa, alongside a U‑shaped age‑specific mortality pattern [23]. Consistent with these findings, the present study confirms an overall decline in MMR and DALYs; however, the observed slowdown since 2016 particularly pronounced in high‑SDI regions suggest that recent progress has stalled, potentially due to the COVID‑19 pandemic, economic instability, and political challenges, underscoring persistent maternal health inequities.
Tong's study analyzed global, regional, and national trends in pregnancy loss incidence, disability-adjusted life years (DALYs), and maternal mortality, as well as their associations with factors such as physical condition, lifestyle, sleep, and health status. The study found that approximately 42.39 million cases of pregnancy loss were reported worldwide in 2019. From 1990 to 2019, incidence, DALYs, and mortality generally declined, although some countries experienced increases. Higher socio-demographic index (SDI) levels were negatively correlated with pregnancy loss rates, and this decline is projected to continue through 2030. Significant risk factors included poor overall health, smoking, sedentary behavior, lower education levels, and low maternal birth weight, while moderate-to-vigorous physical activity was identified as a protective factor [24]. The findings of this study align with Tong's study in confirming an overall improvement in maternal health outcomes over time, particularly in high-SDI countries. However, disparities persist, with lower-SDI regions continuing to bear a significantly higher. Together, our results and the findings from Tong et al. highlight the complex interplay between socio-demographic, behavioral, and health system factors in shaping maternal health outcomes. They point to the urgent need for multifaceted strategies that address both medical and social determinants-particularly in low-SDI countries where progress remains uneven.
The strengths and limitations of the study
This study has several limitations that should be acknowledged. First, the analysis relies on estimates from the GBD 2021 study, which are derived from multiple data sources of varying quality. Although the GBD applies rigorous methods to adjust for missing, sparse, and low-quality data, abortion- and miscarriage-related outcomes may still be underreported or misclassified, particularly in low-SDI settings where vital registration systems are incomplete and legal or cultural sensitivities surrounding abortion may affect reporting accuracy. As a result, maternal mortality and DALY estimates related to unsafe abortion may be underestimated in some regions. Second, the GBD estimates are generated using statistical modeling approaches to address data gaps, especially in countries with limited primary data. While these methods improve comparability across countries and over time, they introduce uncertainty that should be considered when interpreting regional and temporal trends. Although uncertainty intervals accompany all estimates, the present study did not perform additional sensitivity analyses beyond those embedded within the GBD framework.
Third, while this study examines age groups and socio-demographic differences using SDI categories, it does not fully capture contextual factors such as cultural norms, legal frameworks, healthcare system quality, or access to safe reproductive health services, all of which may substantially influence abortion- and miscarriage-related outcomes. Finally, the use of quantitative indicators such as mortality rates and DALYs does not reflect qualitative dimensions, including women’s lived experiences and barriers to accessing reproductive healthcare. Future studies integrating qualitative data and country-specific policy contexts may provide a more comprehensive understanding of maternal health outcomes related to abortion and miscarriage.
Conclusion
This study demonstrates a significant decline in the age-standardized DALY rate and MMR from 1990 to 2021, with the most substantial reductions occurring between 1999 and 2002. While all SDI levels experienced improvements, disparities persist, with low-SDI countries still bearing the highest burden. Despite continued progress, the rate of decline has slowed in recent years, highlighting the need for sustained and targeted interventions, particularly in lower-income regions. Strengthening healthcare systems, improving maternal care access, and addressing social determinants remain critical for further reducing maternal health burdens globally.
Ethicals Consideration
Not Applicable
Acknowledgements
Not Applicable
Conflict of Interest
The authors declare no conflict of interest.
Funding
This research received no specific grant from any funding agency in the public, commercial, or not-for-profit sectors.
Authors' Contributions
FM contributed to data extraction, statistical analysis, and drafting the manuscript.
AM conceptualized the study, supervised the methodology, critically revised the manuscript, and is the corresponding author. ZF contributed to interpretation of the findings, literature review, and manuscript editing. All authors read and approved the final manuscript.
Artificial Intelligence Utilization
The authors used the generative AI tool ChatGPT (OpenAI, GPT-4, https://chat.openai.com) solely for English language editing and improvement of grammar and phrasing. No content was generated or interpreted by the tool. All scientific content and interpretations were developed by the authors and thoroughly reviewed and verified for accuracy.
Data Availability Statement
The dataset used in the present study is available from the corresponding author upon reasonable request.
Knowledge Translation Statement
Audience: Nursing managers and hospital administrators
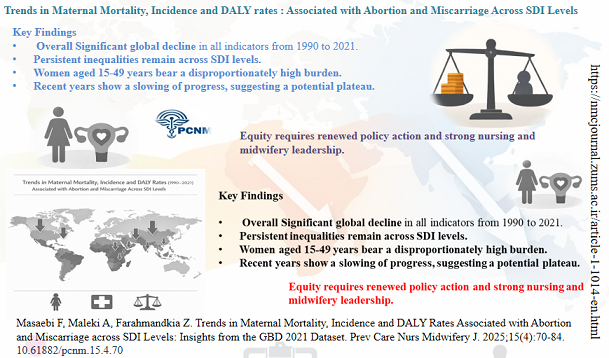
Global maternal mortality and DALY rates from abortion and miscarriage declined significantly from 1990 to 2021, but low-SDI countries still bear burdens over 100-fold higher than high-SDI countries, with incidence declining more slowly than mortality. Nursing managers in low-resource settings should strengthen post-abortion care, ensure access to safe family planning, train midwives in emergency obstetric care, and address sociocultural barriers, as recent progress has slowed and sustained targeted interventions remain critical for achieving SDG targets.
Full-Text: (141 Views)
Introduction
Maternal mortality remains a major global public health concern.The WHO defines maternal mortality as the death of a woman during pregnancy, childbirth, or within 42 days of the termination of pregnancy due to pregnancy-related causes [1]. Annually, many women die from preventable pregnancy-related causes, predominantly in low-income countries [2]. Among the significant factors contributing to maternal deaths, abortion and miscarriage are particularly critical, accounting for approximately 13% of maternal deaths annually in low- and middle-income countries (LMICs), where unsafe abortion remains a leading yet preventable cause [3, 4]. In a regional study conducted in Iran (2017), the prevalence of unplanned pregnancy was reported to be about 36%, and unwanted pregnancy accounted for approximately 5% [5]. A comparison of global trends indicates that between 1990-1994 and 2015-2019, the global rate of unintended pregnancies has declined, while the percentage of these pregnancies ending in abortion has increased [6]. Unsafe abortion is typically performed under non-medical conditions and can lead to severe complications like hemorrhage, infection, uterine rupture, and organ failure. Miscarriage, often caused by fetal abnormalities, maternal health issues, or environmental factors, typically requires medical management and psychological support to avoid further complications [7, 8]. The global burden of complications resulting from unsafe abortion is significant yet challenging to quantify. A systematic review analyzing hospital-based studies assessed the prevalence and types of abortion-related complications in settings where abortion is generally unsafe. The review included 43 studies. The proportion of women treated for severe complications ranged from 1.6% for renal failure to 7.2% for severe trauma [9]. Healthcare systems in many LMICs face substantial challenges in managing the complications arising from unsafe abortions and miscarriages. These complications often necessitate emergency obstetric care, blood transfusions, and surgical interventions [10].
The Global Burden of Disease (GBD) framework highlights abortion and miscarriage as major contributors to maternal morbidity and mortality, particularly through their impact on disability-adjusted life year (DALYs) [11]. These effects extend beyond physical complications to include psychological disorders such as depression, anxiety, and post-traumatic stress disorder (PTSD), significantly diminishing women's quality of life [11, 12]. Additionally, the economic burden extends beyond healthcare costs to include productivity loss and increased caregiving responsibilities [13, 14]. Regional disparities in DALY rates reflect the intersection of socio-economic factors and healthcare accessibility. For example, in 2019, Afghanistan had the highest prevalence and incidence of spontaneous abortion, while Yemen reported the highest abortion-related mortality and DALY rates. Notably, between 1990 and 2019, the North Africa and Middle East (NAME) region experienced a 56% decline in average prevalence and incidence rates and an 89% reduction in abortion-related mortality and DALYs. Additionally, iron deficiency was identified as a significant contributing factor to the burden of spontaneous abortion, with Yemen showing the highest attributable burden (29%) [15]. Over the past decades, various strategies have significantly reduced maternal mortality. However, challenges such as healthcare inequities, political instability, and global crises like COVID-19 may impact the progress towards achieving the Sustainable Development Goal (SDG) target of reducing MMR to less than 70 per 100,000 live births by 2030, particularly in low-income countries [16, 17].
Despite the substantial global burden of abortion- and miscarriage-related maternal outcomes, evidence on age-disaggregated and SDI-stratified trends remains limited. This study addresses this gap by examining maternal mortality and DALYs among women aged 15–49 years, in line with the WHO definition of reproductive age. The findings are particularly relevant for low-SDI and low- and middle-income settings, where nurses and midwives play a key role in prevention, early detection, and clinical management. By highlighting age-specific and socioeconomic disparities, this study informs targeted preventive strategies, improved referral pathways, and capacity building efforts to strengthen maternal health care.
Objectives
This study aims to analyze maternal mortality and DALY rates related to abortion and miscarriage using GBD 2021 data, focusing on both age-standardized rates and females aged 15-49, and examining differences across Socio-Demographic Index (SDI) levels.
Methods
GBD Data Set
This secondary data analysis utilized the GBD 2021 dataset to obtain maternal mortality ratios (MMRs), incidence rates, and disability‑adjusted life year (DALY) estimates related to abortion and miscarriage. This data is collected for more than 200 countries and territories, categorized by sex and age group, from 1990 to 2021. In this study, we extracted age-standardized Incidence, MMR and DALY rates associated with maternal abortion and miscarriage from the GBD 2021 dataset.
The analysis was conducted for both age-standardized rates and the 15-49-year-old female population, further stratified by Socio-Demographic Index (SDI) categories to examine disparities across different socio-economic contexts. More detailed information about the GBD 2021 study and the standardization methods can be found in previous literature.
To analyze the trend of incidence, MMR and DALY rates related to maternal abortion and miscarriage, we reported the mean values globally, as well as across different SDI levels and age categories. Additionally, to identify changing trends in incidence, MMR and DALY rates over the study period, joinpoint regression analysis was employed. Joinpoint regression was used to examine changes in trends over time. In simple terms, this method identifies years in which the direction or magnitude of a trend significantly changes. Instead of assuming a single constant trend across the entire study period, joinpoint analysis allows the trend to be divided into several segments, each with its own rate of increase or decrease.
This method involves fitting a segmented linear regression model to the observed data, which detects points in time (joinpoints) where significant shifts in the trend occur. The general model can be described as follows:
Maternal mortality remains a major global public health concern.The WHO defines maternal mortality as the death of a woman during pregnancy, childbirth, or within 42 days of the termination of pregnancy due to pregnancy-related causes [1]. Annually, many women die from preventable pregnancy-related causes, predominantly in low-income countries [2]. Among the significant factors contributing to maternal deaths, abortion and miscarriage are particularly critical, accounting for approximately 13% of maternal deaths annually in low- and middle-income countries (LMICs), where unsafe abortion remains a leading yet preventable cause [3, 4]. In a regional study conducted in Iran (2017), the prevalence of unplanned pregnancy was reported to be about 36%, and unwanted pregnancy accounted for approximately 5% [5]. A comparison of global trends indicates that between 1990-1994 and 2015-2019, the global rate of unintended pregnancies has declined, while the percentage of these pregnancies ending in abortion has increased [6]. Unsafe abortion is typically performed under non-medical conditions and can lead to severe complications like hemorrhage, infection, uterine rupture, and organ failure. Miscarriage, often caused by fetal abnormalities, maternal health issues, or environmental factors, typically requires medical management and psychological support to avoid further complications [7, 8]. The global burden of complications resulting from unsafe abortion is significant yet challenging to quantify. A systematic review analyzing hospital-based studies assessed the prevalence and types of abortion-related complications in settings where abortion is generally unsafe. The review included 43 studies. The proportion of women treated for severe complications ranged from 1.6% for renal failure to 7.2% for severe trauma [9]. Healthcare systems in many LMICs face substantial challenges in managing the complications arising from unsafe abortions and miscarriages. These complications often necessitate emergency obstetric care, blood transfusions, and surgical interventions [10].
The Global Burden of Disease (GBD) framework highlights abortion and miscarriage as major contributors to maternal morbidity and mortality, particularly through their impact on disability-adjusted life year (DALYs) [11]. These effects extend beyond physical complications to include psychological disorders such as depression, anxiety, and post-traumatic stress disorder (PTSD), significantly diminishing women's quality of life [11, 12]. Additionally, the economic burden extends beyond healthcare costs to include productivity loss and increased caregiving responsibilities [13, 14]. Regional disparities in DALY rates reflect the intersection of socio-economic factors and healthcare accessibility. For example, in 2019, Afghanistan had the highest prevalence and incidence of spontaneous abortion, while Yemen reported the highest abortion-related mortality and DALY rates. Notably, between 1990 and 2019, the North Africa and Middle East (NAME) region experienced a 56% decline in average prevalence and incidence rates and an 89% reduction in abortion-related mortality and DALYs. Additionally, iron deficiency was identified as a significant contributing factor to the burden of spontaneous abortion, with Yemen showing the highest attributable burden (29%) [15]. Over the past decades, various strategies have significantly reduced maternal mortality. However, challenges such as healthcare inequities, political instability, and global crises like COVID-19 may impact the progress towards achieving the Sustainable Development Goal (SDG) target of reducing MMR to less than 70 per 100,000 live births by 2030, particularly in low-income countries [16, 17].
Despite the substantial global burden of abortion- and miscarriage-related maternal outcomes, evidence on age-disaggregated and SDI-stratified trends remains limited. This study addresses this gap by examining maternal mortality and DALYs among women aged 15–49 years, in line with the WHO definition of reproductive age. The findings are particularly relevant for low-SDI and low- and middle-income settings, where nurses and midwives play a key role in prevention, early detection, and clinical management. By highlighting age-specific and socioeconomic disparities, this study informs targeted preventive strategies, improved referral pathways, and capacity building efforts to strengthen maternal health care.
Objectives
This study aims to analyze maternal mortality and DALY rates related to abortion and miscarriage using GBD 2021 data, focusing on both age-standardized rates and females aged 15-49, and examining differences across Socio-Demographic Index (SDI) levels.
Methods
GBD Data Set
This secondary data analysis utilized the GBD 2021 dataset to obtain maternal mortality ratios (MMRs), incidence rates, and disability‑adjusted life year (DALY) estimates related to abortion and miscarriage. This data is collected for more than 200 countries and territories, categorized by sex and age group, from 1990 to 2021. In this study, we extracted age-standardized Incidence, MMR and DALY rates associated with maternal abortion and miscarriage from the GBD 2021 dataset.
The analysis was conducted for both age-standardized rates and the 15-49-year-old female population, further stratified by Socio-Demographic Index (SDI) categories to examine disparities across different socio-economic contexts. More detailed information about the GBD 2021 study and the standardization methods can be found in previous literature.
To analyze the trend of incidence, MMR and DALY rates related to maternal abortion and miscarriage, we reported the mean values globally, as well as across different SDI levels and age categories. Additionally, to identify changing trends in incidence, MMR and DALY rates over the study period, joinpoint regression analysis was employed. Joinpoint regression was used to examine changes in trends over time. In simple terms, this method identifies years in which the direction or magnitude of a trend significantly changes. Instead of assuming a single constant trend across the entire study period, joinpoint analysis allows the trend to be divided into several segments, each with its own rate of increase or decrease.
This method involves fitting a segmented linear regression model to the observed data, which detects points in time (joinpoints) where significant shifts in the trend occur. The general model can be described as follows:
where
Moreover, the Average Annual Percent Change (AAPC) was derived as a weighted average of the APC values, with the segment lengths serving as weights. The statistical significance of APC and AAPC estimates was evaluated using 95% confidence intervals. Join point regression analysis was conducted using Joinpoint Regression Software version 4.8.0.1
Result
This secondary analysis of publicly available GBD data presents global and SDI‑stratified trends in the incidence, MMR, and DALY burden due to maternal abortion and miscarriage from 1990 to 2021. All rates are age‑standardized unless otherwise noted, and uncertainty is expressed as 95% uncertainty intervals (UI). Descriptive statistics for DALY, MMR, and incidence rates at selected time points are shown in Table 1, and their overall temporal patterns are illustrated in Figure 1. Globally, all three indicators declined between 1990 and 2021. The DALY rate decreased from 104.39 to 25.73 per 100 000, the MMR from 36.07 to 12.92 per 100 000, and the incidence rate from 1603.84 to 1001.64 per 100 000. The magnitude of decline varied substantially across SDI groups. In 2021, the DALY and MMR rates in low‑SDI countries were more than 100‑fold higher than those in high‑SDI countries (DALY: 113.27 vs. 0.75 per 100 000; MMR: 28.49 vs. 0.25 per 100 000). Incidence rates also remained disproportionately high in low‑SDI regions (1715.09 per 100 000 in 2021).
Table 1. Descriptive statistics for age-standardized and age-specific (15-49 years) DALY, maternal mortality and incidence rates per 100,000 from 1990 to 2021 by SDI level.
| Age-standardized rate | ||||||||
| SDI | Index | 1990 | 1995 | 2000 | 2005 | 2010 | 2015 | 2021 |
| High-middle SDI | DALY | 12.61 | 8.87 | 6.44 | 4.31 | 3.25 | 2.56 | 1.84 |
| Maternal Mortality | 6.12 | 5.29 | 4.24 | 2.78 | 2.01 | 1.26 | 0.96 | |
| Incidence | 1298.39 | 1048.17 | 981.02 | 896.94 | 820.31 | 820.78 | 813.11 | |
| High SDI | DALY | 2.72 | 2.01 | 1.64 | 1.29 | 1.06 | 0.90 | 0.75 |
| Maternal Mortality | 1.07 | 0.76 | 0.57 | 0.48 | 0.39 | 0.32 | 0.25 | |
| Incidence | 1062.39 | 961.40 | 925.78 | 675.08 | 573.35 | 520.96 | 492.05 | |
| Low-middle | DALY | 219.95 | 169.06 | 122.69 | 83.99 | 60.80 | 41.43 | 28.48 |
| Maternal Mortality | 53.37 | 44.33 | 35.50 | 26.27 | 20.29 | 15.34 | 12.36 | |
| Incidence | 1921.72 | 1767.93 | 1602.27 | 1480.17 | 1346.20 | 1190.43 | 1008.85 | |
| Low | DALY | 537.08 | 461.82 | 388.94 | 297.12 | 221.62 | 165.93 | 113.27 |
| Maternal Mortality | 91.19 | 79.27 | 69.37 | 55.49 | 44.31 | 36.62 | 28.49 | |
| Incidence | 2489.63 | 2425.75 | 2304.22 | 2302.39 | 2157.90 | 1958.52 | 1715.09 | |
| Middle | DALY | 41.15 | 31.78 | 24.74 | 17.65 | 12.86 | 9.24 | 7.25 |
| Maternal Mortality | 14.61 | 13.35 | 12.06 | 9.07 | 6.81 | 4.62 | 4.35 | |
| 1608.64 | 1386.23 | 1251.76 | 1160.61 | 1108.38 | 1076.41 | 908.14 | ||
| Global | DALY | 104.39 | 86.89 | 71.88 | 54.97 | 42.82 | 33.44 | 25.73 |
| Maternal Mortality | 36.07 | 33.19 | 29.67 | 23.56 | 18.89 | 14.87 | 12.92 | |
| Incidence | 1603.84 | 1436.34 | 1340.63 | 1248.95 | 1176.02 | 1117.33 | 1001.64 | |
| Women aged 15-49 years | ||||||||
| High-middle SDI | DALY | 26.05 | 18.01 | 12.77 | 8.42 | 6.34 | 4.87 | 3.45 |
| Maternal Mortality | 6.07 | 5.25 | 4.21 | 2.74 | 1.98 | 1.24 | 0.95 | |
| Incidence | 2797.55 | 2141.46 | 1902.21 | 1712.13 | 1591.36 | 1565.98 | 1502.09 | |
| High SDI | DALY | 5.35 | 3.84 | 3.10 | 2.42 | 2.02 | 1.74 | 1.48 |
| Maternal Mortality | 1.05 | 0.75 | 0.55 | 0.47 | 0.38 | 0.31 | 0.25 | |
| Incidence | 2113.31 | 1835.27 | 1727.58 | 1250.11 | 1080.22 | 1005.53 | 961.68 | |
| Low-middle | DALY | 431.57 | 333.08 | 243.38 | 167.30 | 121.16 | 82.12 | 56.95 |
| Maternal Mortality | 52.56 | 43.66 | 35.00 | 25.85 | 19.96 | 15.04 | 12.42 | |
| Incidence | 4296.24 | 3930.38 | 3536.32 | 3249.41 | 2929.35 | 2551.40 | 2121.14 | |
| Low | DALY | 1036.53 | 888.99 | 749.17 | 574.03 | 428.18 | 318.99 | 218.64 |
| Maternal Mortality | 89.92 | 78.20 | 68.52 | 54.75 | 43.69 | 36.09 | 28.11 | |
| Incidence | 5451.58 | 5318.99 | 5064.83 | 5097.10 | 4747.29 | 4263.37 | 3697.07 | |
| Middle | DALY | 81.98 | 64.24 | 49.81 | 35.15 | 25.48 | 18.25 | 14.33 |
| Maternal Mortality | 14.47 | 13.23 | 11.94 | 8.96 | 6.69 | 4.53 | 4.29 | |
| Incidence | 3690.94 | 3049.05 | 2600.62 | 2352.01 | 2230.04 | 2108.73 | 1727.63 | |
| Global | DALY | 208.50 | 174.10 | 143.63 | 109.34 | 85.01 | 66.13 | 50.88 |
| Maternal Mortality | 35.53 | 32.70 | 29.26 | 23.20 | 18.59 | 14.61 | 12.72 | |
| Incidence | 3507.81 | 3052.15 | 2765.35 | 2548.81 | 2392.75 | 2241.64 | 1976.32 | |
Table 2. Results of the Joinpoint Regression Models for Trends in Age-Standardized DALY, Maternal Mortality Ratio, and Incidence by SDI Groups (1990–2021)
| Segments | DALY | |||||||||
| High middle SDI | High SDI | Low middle SDI | Low SDI | Middle SDI | ||||||
| Year | APC (95 % CL) |
Year | APC (95 % CL) |
Year | APC (95 % CL) |
Year | APC (95 % CL) |
Year | APC (95 % CL) |
|
| Trend 1 | 1990-1992 | -8.91* (-9.73, -7.26) |
1990-1996 | -5.80* (-6.21, -5.54) |
1990-1998 | -4.98* (-5.32, -4.65) |
1990-1999 | -2.99* (-3.09, -2.88) |
1990-1998 | -4.52* (-4.88, -4.02) |
| Trend 2 | 1992-1999 | -5.46* (-5.73, -4.88) |
1996-2000 | -3.67* (-4.06, -2.95) |
1998-2003 | -8.29* (-9.24, -7.28) |
1999-2005 | -5.19* (-5.35, -4.40) |
1998-2015 | -6.26* (-6.45, -6.13) |
| Trend 3 | 1999-2005 | -7.95* (-8.55, -7.62) |
2000-2003 | -5.67* (-6.13, -4.99) |
2003-2007 | -5.24* (-7.79, -4.27) |
2005-2017 | -5.59* (-5.69, -5.50) |
2015-2021 | -4.34* (-4.95, -3.12) |
| Trend 4 | 2005-2009 | -4.57* (-4.98, -3.52) |
2003-2008 | -2.93* (-3.20, -2.22) |
200-2019 | -7.01* (-7.66, -5.80) |
2017-2021 | -6.62* (-7.12, -6.31) |
--- | --- |
| Trend 5 | 2009-2012 | -7.78* (-8.38, -6.95) |
2008-2011 | -4.96* (-5.31, -4.21) |
2019-2021 | -4.95* (-6.83, -4.02) |
--- | --- | --- | --- |
| Trend 6 | 2012-2015 | -2.65* (-3.48, -2.06) |
2011-2021 | -3.06* (-3.18, -2.88) |
--- | --- | --- | --- | --- | --- |
| Trend 7 | 2015-2021 | -5.49* (-5.89, -5.26) |
---- | --- | --- | --- | --- | --- | --- | --- |
| AAPC | 1990-2021 | -6.03 (-6.08, -5.95) |
1990-2021 | -4.09 (-4.13, -4.05) |
1990-2021 | -6.34 (-6.44, -6.28) |
1990-2021 | -4.90 (-4.94, - 4.87) |
1990-2021 | -5.44* (-5.53, -5.35) |
| Maternal Mortality Ratio | ||||||||||
| Trend 1 | 1990-1999 | -2.73* (-3.16, -2.36) |
1990-1998 | -6.77* (-7.62, -6.44) |
1990-1999 | -3.54* (-3.80, -3.26) |
1990-1999 | -2.56* (-2.76, -2.37) |
1990-1994 | -2.04* (-3.40, -1.35) |
| Trend 2 | 1999-2006 | -8.28* (-9.46, -7.73) |
1998-2002 | -5.17* (-6.19, -2.12) |
1999-2003 | -7.17* (-8.24, -6.31) |
1999-2011 | -4.26* (-4.57, -4.06) |
1994-1998 | -0.21 (-1.34, 0.47) |
| Trend 3 | 2006-2009 | -5.41* (-7.08, -4.49) |
2002-2008 | -1.87* (-5.50, -0.72) |
2003-2006 | -3.50* (-4.64, -2.76) |
2011-2017 | -3.55* (-4.20, -2.84) |
1998-2009 | -5.30* (-5.49, -5.12) |
| Trend 4 | 2009-2016 | -8.73* (-9.87, -8.30) |
2008-2011 | -6.26* (-6.88, -3.89) |
2006-2015 | -5.43* (-6.44, -5.20) |
2017-2021 | -4.54* (-5.34, -3.95) |
2009-2016 | -7.05* (-7.39, -6.77) |
| Trend 5 | 2016-2021 | -3.51* (-4.41, -2.23) |
2011-2021 | -3.62* (-3.89, -3.24) |
2015-2021 | -3.79* (-4.31, -2.91) |
--- | --- | 2016-2021 | -0.34 (-0.75, 0.05) |
| AAPC | 1990-2021 | -5.76* (-5.86, -5.67) |
1990-2021 | -4.57* (-4.64, -4.50) |
1990-2021 | -4.61* (-4.68, -4.55) |
1990-2021 | -3.67* (-3.73, -3.62) |
1990-2021 | -3.86* (-3.93, -3.79) |
| Incidence | ||||||||||
| Trend 1 | 1990-1994 | -4.58* (-5.60, -3.83 |
1990-1993 | -2.38* (-3.45, -1.58) |
1990-1996 | -1.66* (-1.70, -1.60) |
1990-1996 | -0.56* (-0.64, -0.49) |
1990-1994 | -3.08* (-3.20, -2.98) |
| Trend 2 | 1994-2010 | -1.66* (-1.77, -1.55) |
1993-2001 | -0.98* (-1.16, -0.59) |
1996-2000 | -2.04* (-2.16, -1.95) |
1996-2000 | -1.18* (-1.30, -1.06) |
1994-1998 | -2.17* (-2.37, -2.06) |
| Trend 3 | 2010-2021 | -0.11 (-0.28,0.11) |
2001-2004 | -8.14* (-8.59, -7.70) |
2000-2006 | -1.55* (-1.60, -1.48) |
2000-2005 | 0.08* (0.011,0.15) |
1998-2003 | -1.76* (-1.86, -1.62) |
| Trend 4 | --- | --- | 2004-2009 | -3.65* (-4.21, -3.24) |
2006-2012 | -1.97* (-2.01, -1.93) |
2005-2010 | -1.30* (-1.38, -1.21) |
2003-2009 | -1.10* (-1.18, -1.02) |
| Trend 5 | --- | --- | 2009-2019 | -1.96* (-2.16, -1.78) |
2012-2021 | -2.72* (-2.74, 2.69) |
2010-2015 | -1.95* (-2.04, -1.78) |
2009-2013 | -0.25* (-0.36, -0.12) |
| Trend 6 | --- | --- | 2019-2021 | 0.73 (-0.64,1.41) |
--- | --- | 2015-2021 | -2.24* (-2.34, -2.17) |
2013-2016 | -1.30* (-1.41, -1.17) |
| Trend 7 | --- | --- | --- | --- | --- | --- | --- | --- | 2016-2021 | -3.03* (-3.11, -2.96) |
| AAPC | 1990-2021 | -1.49* (-1.55, -1.42) |
1990-2021 | -2.47* (-2.54, -2.41) |
1990-2021 | -2.06* (-2.06, -2.05) |
1990-2021 | -1.21* (-1.22, -1.20) |
1990-2021 | -1.83* (-1.84, -1.82) |
* Indicates that the APC is significantly different from zero
DALY trends by SDI
High‑SDI countries showed the lowest burden throughout the period, with DALY rates falling from 2.72 to 0.75 per 100 000. The steepest annual decline occurred between 1990‑1996 (annual percent change (APC = ‑5.80%, 95% UI: ‑6.21, ‑5.54). High‑middle‑SDI regions exhibited the most rapid long‑term reduction (average annual percent change (AAPC = ‑6.03%, 95% UI: ‑6.08, ‑5.95), while low‑SDI countries, despite a marked decrease from 537.08 to 113.27 per 100 000, had the slowest overall decline (AAPC = ‑4.90%, 95% UI: ‑4.94, ‑4.87). Detailed APC and AAPC values for each SDI group are provided in Table 2.
MMR trends by SDI
MMR patterns closely mirrored those of DALY. High‑middle‑SDI regions achieved the largest long‑term reduction (AAPC = ‑5.76%, 95% UI: ‑5.86, ‑5.67), whereas low‑SDI countries showed the smallest decline (AAPC = ‑3.67%, 95% UI: ‑3.73, ‑3.62). Periods of stagnation or minimal change were observed in several SDI groups, most notably in low‑SDI countries during the early 1990s and in middle‑SDI countries between 1994‑1998.
Incidence trends by SDI
Incidence rates declined more slowly than DALY and MMR across all SDI levels. High‑SDI countries experienced the greatest reduction (AAPC = ‑2.47%, 95% UI: ‑2.54, ‑2.41), while low‑SDI regions had the smallest decline (AAPC = ‑1.21%, 95% UI: ‑1.22, ‑1.20). In low‑SDI countries, the trend included intervals of stagnation or slight increase, such as a positive APC of 0.26% between 2000‑2005.
High‑SDI countries showed the lowest burden throughout the period, with DALY rates falling from 2.72 to 0.75 per 100 000. The steepest annual decline occurred between 1990‑1996 (annual percent change (APC = ‑5.80%, 95% UI: ‑6.21, ‑5.54). High‑middle‑SDI regions exhibited the most rapid long‑term reduction (average annual percent change (AAPC = ‑6.03%, 95% UI: ‑6.08, ‑5.95), while low‑SDI countries, despite a marked decrease from 537.08 to 113.27 per 100 000, had the slowest overall decline (AAPC = ‑4.90%, 95% UI: ‑4.94, ‑4.87). Detailed APC and AAPC values for each SDI group are provided in Table 2.
MMR trends by SDI
MMR patterns closely mirrored those of DALY. High‑middle‑SDI regions achieved the largest long‑term reduction (AAPC = ‑5.76%, 95% UI: ‑5.86, ‑5.67), whereas low‑SDI countries showed the smallest decline (AAPC = ‑3.67%, 95% UI: ‑3.73, ‑3.62). Periods of stagnation or minimal change were observed in several SDI groups, most notably in low‑SDI countries during the early 1990s and in middle‑SDI countries between 1994‑1998.
Incidence trends by SDI
Incidence rates declined more slowly than DALY and MMR across all SDI levels. High‑SDI countries experienced the greatest reduction (AAPC = ‑2.47%, 95% UI: ‑2.54, ‑2.41), while low‑SDI regions had the smallest decline (AAPC = ‑1.21%, 95% UI: ‑1.22, ‑1.20). In low‑SDI countries, the trend included intervals of stagnation or slight increase, such as a positive APC of 0.26% between 2000‑2005.
Table 3. Results of the Joinpoint Regression Models for Global Trends in Age-Standardized and Women Aged 15-49 DALY, Maternal Mortality Rates, and Incidence (1990–2021)
| Category | Segments | DALY | ||
| Maternal Mortality | Incidence | ||||
| Year | APC (95 % CL) | Year | APC (95 % CL) | Year | APC (95 % CL) |
| 1 | Trend 1 | 1990-1999 | -3.33* (-3.50, -3.11) |
||
| 1990-1999 | -1.54* (-2.08, -1.03) |
1990-1994 | -2.32* (-2.39, -2.24) |
|
| Trend 2 | 1999-2002 | -5.96* (-6.31, -5.02) |
| 1999-2002 | -4.88* (-5.21, -1.01) |
1994-2004 | -1.40* (-1.47, -1.38) |
|
| Trend 3 | 2002-2021 | -4.67* (-4.73, -4.57) |
| 2002-2016 | -4.32* (-4.75, -3.05) |
2004-2009 | -1.27* (-1.36, -1.12) |
|
| Trend 4 | --- | --- |
| 2016-2021 | -2.25* (-2.79, -1.26) |
2009-2013 | -0.86* (-0.94, -0.72) |
|
| Trend 5 | --- | --- |
| --- | --- | 2013-2016 | -1.37* (-1.46, -1.20) |
|
| Trend 6 | --- | --- |
| --- | --- | 2016-2019 | -2.07* (-2.17, -1.94) |
|
| Trend 7 | --- | --- |
| --- | --- | 2019-2021 | -1.51* (-1.70, -1.35) |
|
| AAPC | 1990-2021 | -4.41* (-4.45, -4.37) |
| 1990-2021 | -3.24* (-3.31, -3.19) |
1990-2021 | -1.50* (-1.51, -1.49) |
|
| 2 | Trend 1 | 1990-1999 | -3.33* (-3.51, -3.10) |
| 1990-1999 | -1.65* (-1.94, -1.44) |
1990-1994 | -2.85* (-3.04, -2.75) |
|
| Trend 2 | 1999-2002 | -6.12* (-6.46, -5.14) |
| 1999-2016 | -4.42* (-4.52, -4.33) |
1994-1997 | -2.17* (-2.51, -1.89) |
|
| Trend 3 | 2002-2021 | -4.71* (-4.78, -4.62) |
| 2016-2021 | -2.11* (-2.65, -1.30) |
1997-2003 | -1.83* (-1.88, -1.32) |
|
| Trend 4 | --- | --- |
| --- | --- | 2003-2015 | -1.25* (-1.27, -1.22) |
|
| Trend 5 | --- | --- |
| --- | --- | 2015-2019 | -2.27* (-2.39, -2.20) |
|
| Trend 6 | --- | --- |
| --- | --- | 2019-2021 | -1.80* (-2.06, -1.64) |
|
| AAPC | 1990-2021 | -4.45* (-4.49, -4.41) |
| 1990-2021 | -3.25* (-3.32, -3.20) |
1990-2021 | -1.83* (-1.84, -1.82) |
* Indicates that the APC is significantly different from zero, 1 = Age-standardized rate, 2 = Women aged 15-49 years.
Table 4. Joinpoint Regression Analysis of Trends in DALY, Maternal Mortality Ratio and Incidence among Women Aged 15-49 by SDI Groups (1990–2021)
| Segments | DALY | |||||||||
| High middle SDI | High SDI | Low middle SDI | Low SDI | MiddleSDI | ||||||
| Year | APC (95 % CL) |
Year | APC (95 % CL) |
Year | APC (95 % CL) |
Year | APC (95 % CL) |
Year | APC (95 % CL) |
|
| Trend 1 | 1990-1992 | -9.01* (-9.75, -7.57) |
1990-1996 | -6.38* (-6.86, -6.10) |
1990-1998 | -4.91* (-5.24, -4.60) |
1990-1999 | -4.91* (-5.24, -4.60) |
1990-1998 | -4.42* (-4.78, -3.97) |
| Trend 2 | 1992-1999 | -5.95* (-6.21, -5.44) |
1996-2000 | -3.88* (-4.38, -3.07) |
1998-2003 | -8.18* (-9.14, -7.48) |
1999-2006 | -8.18* (-9.14, -7.48) |
1998-2015 | -6.38* (-6.55, -6.27) |
| Trend 3 | 1999-2005 | -8.25* (-8.67, -7.95) |
2000-2003 | -5.81* (-6.34, -5.01) |
2003-2007 | -5.20* (-6.10, -4.21) |
2006-2017 | -5.20* (-6.10, -4.21) |
2015-2021 | -4.26* (-4.81, -3.38) |
| Trend 4 | 2005-2009 | -4.45* (-4.83, -3.64) |
2003-2008 | -2.83* (-3.16, -1.94) |
2007-2019 | -7.02* (-7.52, -6.87) |
2017-2021 | -7.02* (-7.52, -6.87) |
--- | --- |
| Trend 5 | 2009-2012 | -8.13* (-8.65, -7.30) |
2008-2011 | -4.47* (-4.87, -3.65) |
2019-2021 | -4.64* (-6.62, -3.68) |
--- | --- | --- | --- |
| Trend 6 | 2012-2015 | -3.23* (-3.98, -2.71) |
2011-2021 | -2.85* (-2.99, -2.61) |
--- | --- | --- | --- | --- | --- |
| Trend 7 | 2015-2021 | -5.76* (-6.14, -5.56) |
--- | --- | --- | --- | --- | --- | --- | --- |
| AAPC | 1990-2021 | -6.33* (-6.38, -6.25) |
1990-2021 | -4.12* (-4.16, -4.07) |
1990-2021 | -6.28* (-6.38, -6.22) |
1990-2021 | -4.89* (-4.94, -4.87) |
1990-2021 | -5.47* (-5.55, 5.39) |
| Maternal Mortality Ratio | ||||||||||
| Trend 1 | 1990-1999 | -2.73* (-3.16, -2.35) |
1990-1998 | -6.78* (-7.61, -6.45) |
1990-1999 | -3.53* (-3.79, -3.25) |
1990-1993 | -3.05* (-3.68, -2.54) |
1990-1994 | -2.03* (-3.36, -1.38) |
| Trend 2 | 1999-2006 | -8.33* (-9.53, -7.77) |
1998-2002 | -5.16* (-6.19, -2.12) |
1999-2003 | -7.19* (-8.28, -6.35) |
1993-1999 | -2.39* (-4.36, -2.05) |
1994-1998 | -0.20 (-0.92, 0.47) |
| Trend 3 | 2006-2009 | -5.41* (-7.10, -4.48) |
2002-2008 | -1.81* (-5.37, -0.68) |
2003-2006 | -3.48* (-4.63, -2.76) |
1999-2011 | -4.29* (-4.43, -4.11) |
1998-2009 | -5.35* (-5.53, -5.18) |
| Trend 4 | 2009-2016 | -8.77* (-9.97, -8.34) |
2008-2011 | -6.31* (-6.92, -4.00) |
2006-2015 | -5.47* (-6.42, -5.25) |
2011-2017 | -3.53* (-3.74, -3.09) |
2009-2016 | -7.13* (-7.46, -6.85) |
| Trend 5 | 2016-2021 | -3.49* (-4.42, -2.20) |
2011-2021 | -3.58* (-3.84, -3.23) |
2015-2021 | -3.73* (-4.26, -2.90) |
2017-2021 | -4.52* (-5.02, -4.23) |
2016-2021 | -0.23 (-0.64, 0.15) |
| AAPC | 1990-2021 | -5.78* (-5.89, -5.69) |
1990-2021 | -4.55* (-4.63, -4.49) |
1990-2021 | -4.614* (-4.68, -4.55) |
1990-2021 | -3.69* (-3.73, -3.66) |
1990-2021 | -3.87* (-3.94, -3.81) |
| Incidence | ||||||||||
| Trend 1 | 1990-1995 | -5.46* (-5.98, -4.96) |
1990-1994 | -2.94* (-4.06, -2.39) |
1990-1996 | -1.78* (-1.81, -1.74) |
1990-1996 | -0.52* (-0.61, -0.41) |
1990-1995 | -3.79* (-4.05, -3.66) |
| Trend 2 | 1995-2008 | -2.02* (-2.17, -1.88) |
1994-2001 | -1.42* (-1.64, -1.04) |
1996-2000 | -2.17* (-2.25, -2.09) |
1996-2000 | -1.12* (-1.30, -0.97) |
1995-2000 | -3.15* (-3.37, -2.89) |
| Trend 3 | 2008-2021 | -0.55* (-0.69, -0.40) |
2001-2004 | -8.16* (-8.64, -7.69) |
2000-2006 | -1.67* (-1.71, -1.63) |
2000-2005 | 0.26* (0.17,0.35) |
2000-2004 | -2.16* (-2.34, -1.86) |
| Trend 4 | --- | --- | 2004-2008 | -3.73* (-4.48, -3.19) |
2006-2011 | -2.12* (-2.16, -2.08) |
2005-2011 | -1.50* (-1.59, -1.43) |
2004-2015 | -1.01* (-1.05, -0.97) |
| Trend 5 | --- | --- | 2008-2019 | -1.65* (-1.81, -1.50) |
2011-2016 | -2.88* (-2.92, -2.82) |
2011-2021 | -2.34* (-2.38, -2.30) |
2015-2021 | -3.36* (-3.44, -3.30) |
| Trend 6 | --- | --- | 2019-2021 | 0.81 (-0.55,1.50) |
2016-2021 | -3.08* (-3.15, -3.04) |
--- | --- | --- | --- |
| AAPC | 1990-2021 | -1.98* (-2.03, -1.92) |
1990-2021 | -2.52* (-2.59, -2.47) |
1990-2021 | -2.25* (-2.26, -2.26) |
1990-2021 | -1.25* (-1.26, -1.24) |
1990-2021 | -2.42* (-2.43, -2.40) |
* Indicates that the APC is significantly different from zero
Joinpoint regression results
Joinpoint regression was used to identify changes in trend direction. Table 3 summarizes the APC and AAPC for the global population. The sharpest annual decline in DALY rates occurred between 1999‑2002 (APC = ‑5.96%, 95% UI: ‑6.31, ‑5.02), while MMR fell most rapidly during the same interval (APC = ‑4.88%, 95% UI: ‑5.21, ‑1.01). For incidence, the largest reduction was observed in 1990‑1994 (APC = ‑2.32%, 95% UI: ‑2.39, ‑2.24). The overall downward trend was confirmed by statistically significant AAPCs: DALY (‑4.41%, 95% UI: ‑4.45, ‑4.37), MMR (‑3.24%, 95% UI: ‑3.31, ‑3.19), and incidence (‑1.50%, 95% UI: ‑1.51, ‑1.49).
Age‑specific analysis (women aged 15–49 years)
Because maternal health risks concentrate in the reproductive‑age group, we also examined trends among women aged 15–49 years. In this subgroup, DALY rates decreased from 208.50 to 50.88 per 100 000, MMR from 35.53 to 12.72 per 100 000, and incidence from 3507.81 to 1976.32 per 100 000. Disparities across SDI levels remained pronounced in 2021: DALY and MMR rates in low‑SDI countries were more than 8‑fold higher than in high‑SDI countries (DALY: 218.64 vs. 1.48; MMR: 28.11 vs. 0.25 per 100 000), and incidence was nearly four‑fold higher (3697.07 vs. 961.68 per 100 000).
Joinpoint regression for this age group (Table 4) showed significant reductions in all three indicators across every SDI stratum. The fastest long‑term DALY decline occurred in high‑middle‑SDI (AAPC = ‑6.33%, 95% UI: ‑6.38, ‑6.25) and low‑middle‑SDI countries (AAPC = ‑6.28%, 95% UI: ‑6.38, ‑6.22). For MMR, the largest AAPC was observed in high‑middle‑SDI regions (‑5.78%, 95% UI: ‑5.89, ‑5.69). Incidence declines were more modest, with the highest AAPC in high‑SDI countries (‑2.52%, 95% UI: ‑2.59, ‑2.45) and the lowest in low‑SDI countries (‑1.25%, 95% UI: ‑1.26, ‑1.24). Periods of stagnation or minimal change were present in several SDI groups, most consistently in low‑SDI countries.
Discussion
This study provides a comprehensive assessment of long‑term trends in maternal mortality and disability related to abortion and miscarriage, based on GBD 2021 estimates. Overall, the observed downward trends indicate meaningful global progress in maternal health over the past three decades. Despite these encouraging trends, the findings underscore persistent and unequal burdens across socio‑demographic contexts. Women of reproductive age (15-49 years) continue to experience a disproportionately higher burden, highlighting the critical importance of focused reproductive and maternal health services for this group. From a midwifery and nursing perspective, this emphasizes the ongoing need for comprehensive antenatal, post‑abortion, and miscarriage care, including early risk identification, timely referral, and continuity of care across the reproductive life course.
These findings showed that countries have made significant progress toward achieving the Millennium Development Goals (MDGs) in reducing maternal mortality associated with Abortion and Miscarriage. However, they have not yet fully met the Sustainable Development Goals (SDGs). The decline in MMR associated with Abortion and Miscarriage has been particularly notable in low-SDI countries, but the slower reduction in recent years highlights the need for greater focus on effective interventions, strengthening healthcare systems, and improving access to safe pregnancy and childbirth services.
Maternal mortality arises from both direct and indirect causes. Direct causes include postpartum hemorrhage, hypertensive disorders during pregnancy, sepsis, and complications from unsafe abortion. Indirect causes stem from pre-existing health conditions such as HIV, malaria, and cardiovascular diseases [18]. In high-income nations, leading direct causes of maternal death include embolism, sepsis, and hemorrhage, while indirect causes such as cardiac diseases and, more recently, COVID-19, have also been significant contributors [19-21].
The GBD 2017 study reported a decline in age‑standardized incidence rates and DALYs for maternal disorders, with the highest burden observed in low‑ and middle‑income countries, particularly sub‑Saharan Africa. Although abortion and miscarriage had the highest incidence, maternal hemorrhage remained the leading contributor to disease burden, followed by hypertensive and indirect maternal disorders. Despite a slight increase in total cases, the overall maternal disease burden declined, especially in lower‑income regions. Consistent with these findings, the present study demonstrates a significant reduction in maternal mortality and DALY rates over time; however, the recent slowing of progress highlights persistent challenges in achieving the SDGs and underscores the need for sustained maternal health interventions in low‑ and middle‑income settings. [3]. Overall improvements in maternal mortality and DALY rates appear to reflect enhanced access to family planning and contraception, safer abortion services, and strengthened maternal health systems, supported by policy‑driven interventions and global health initiatives. The expansion of skilled birth attendance, broader antenatal and postnatal care coverage, improved emergency obstetric services, and increased public awareness through education and health campaigns have collectively contributed to these favorable trends [22]. Our results showed that the stratified analysis by Socio‑Demographic Index further reveals substantial global inequities. High‑SDI countries consistently demonstrate the lowest burden, likely reflecting robust health systems, legal and safe abortion services, and well‑established midwifery‑led models of care. In contrast, although low‑SDI countries have achieved notable reductions over time, they still bear the highest absolute burden. This pattern aligns with previous GBD reports and underscores the vulnerability of maternal health services in resource‑constrained settings, where shortages of skilled birth attendants, limited access to emergency obstetric care, and sociocultural barriers remain significant challenges [3, 19].
Importantly, the recent slowing of progress in maternal mortality reduction suggests that earlier gains may be reaching a plateau. This trend has critical implications for policy and practice, particularly in low‑SDI countries, where sustaining progress will require renewed investment in midwifery workforce development, strengthening primary health care, and integrating reproductive health services with broader social and health policies. Nurses and midwives play a central role in these efforts, as frontline providers in counseling, prevention of unsafe abortion, management of complications, and advocacy for women’s reproductive rights.
Wei’s GBD 2021 analysis shows a sustained decline in MMR from 1990 to 2021 in high‑SDI regions, while low‑SDI countries continue to bear a disproportionately high maternal mortality burden. Maternal hemorrhage and hypertensive disorders remain the leading causes of death, with notable regional variations, including higher abortion‑related complications in high‑SDI regions and a substantial contribution of HIV/AIDS and other indirect causes in sub‑Saharan Africa, alongside a U‑shaped age‑specific mortality pattern [23]. Consistent with these findings, the present study confirms an overall decline in MMR and DALYs; however, the observed slowdown since 2016 particularly pronounced in high‑SDI regions suggest that recent progress has stalled, potentially due to the COVID‑19 pandemic, economic instability, and political challenges, underscoring persistent maternal health inequities.
Tong's study analyzed global, regional, and national trends in pregnancy loss incidence, disability-adjusted life years (DALYs), and maternal mortality, as well as their associations with factors such as physical condition, lifestyle, sleep, and health status. The study found that approximately 42.39 million cases of pregnancy loss were reported worldwide in 2019. From 1990 to 2019, incidence, DALYs, and mortality generally declined, although some countries experienced increases. Higher socio-demographic index (SDI) levels were negatively correlated with pregnancy loss rates, and this decline is projected to continue through 2030. Significant risk factors included poor overall health, smoking, sedentary behavior, lower education levels, and low maternal birth weight, while moderate-to-vigorous physical activity was identified as a protective factor [24]. The findings of this study align with Tong's study in confirming an overall improvement in maternal health outcomes over time, particularly in high-SDI countries. However, disparities persist, with lower-SDI regions continuing to bear a significantly higher. Together, our results and the findings from Tong et al. highlight the complex interplay between socio-demographic, behavioral, and health system factors in shaping maternal health outcomes. They point to the urgent need for multifaceted strategies that address both medical and social determinants-particularly in low-SDI countries where progress remains uneven.
The strengths and limitations of the study
This study has several limitations that should be acknowledged. First, the analysis relies on estimates from the GBD 2021 study, which are derived from multiple data sources of varying quality. Although the GBD applies rigorous methods to adjust for missing, sparse, and low-quality data, abortion- and miscarriage-related outcomes may still be underreported or misclassified, particularly in low-SDI settings where vital registration systems are incomplete and legal or cultural sensitivities surrounding abortion may affect reporting accuracy. As a result, maternal mortality and DALY estimates related to unsafe abortion may be underestimated in some regions. Second, the GBD estimates are generated using statistical modeling approaches to address data gaps, especially in countries with limited primary data. While these methods improve comparability across countries and over time, they introduce uncertainty that should be considered when interpreting regional and temporal trends. Although uncertainty intervals accompany all estimates, the present study did not perform additional sensitivity analyses beyond those embedded within the GBD framework.
Third, while this study examines age groups and socio-demographic differences using SDI categories, it does not fully capture contextual factors such as cultural norms, legal frameworks, healthcare system quality, or access to safe reproductive health services, all of which may substantially influence abortion- and miscarriage-related outcomes. Finally, the use of quantitative indicators such as mortality rates and DALYs does not reflect qualitative dimensions, including women’s lived experiences and barriers to accessing reproductive healthcare. Future studies integrating qualitative data and country-specific policy contexts may provide a more comprehensive understanding of maternal health outcomes related to abortion and miscarriage.
Conclusion
This study demonstrates a significant decline in the age-standardized DALY rate and MMR from 1990 to 2021, with the most substantial reductions occurring between 1999 and 2002. While all SDI levels experienced improvements, disparities persist, with low-SDI countries still bearing the highest burden. Despite continued progress, the rate of decline has slowed in recent years, highlighting the need for sustained and targeted interventions, particularly in lower-income regions. Strengthening healthcare systems, improving maternal care access, and addressing social determinants remain critical for further reducing maternal health burdens globally.
Ethicals Consideration
Not Applicable
Acknowledgements
Not Applicable
Conflict of Interest
The authors declare no conflict of interest.
Funding
This research received no specific grant from any funding agency in the public, commercial, or not-for-profit sectors.
Authors' Contributions
FM contributed to data extraction, statistical analysis, and drafting the manuscript.
AM conceptualized the study, supervised the methodology, critically revised the manuscript, and is the corresponding author. ZF contributed to interpretation of the findings, literature review, and manuscript editing. All authors read and approved the final manuscript.
Artificial Intelligence Utilization
The authors used the generative AI tool ChatGPT (OpenAI, GPT-4, https://chat.openai.com) solely for English language editing and improvement of grammar and phrasing. No content was generated or interpreted by the tool. All scientific content and interpretations were developed by the authors and thoroughly reviewed and verified for accuracy.
Data Availability Statement
The dataset used in the present study is available from the corresponding author upon reasonable request.
Type of Study: Orginal research |
Subject:
Midwifery
References
1. Patwardhan M, Eckert LO, Spiegel H, Pourmalek F, Cutland C, Kochhar S, et al. Maternal Death: Case Definition and Guidelines for Data Collection, Analysis, and Presentation of Immunization Safety Data. Vaccine. 2016;34(49):6077-83. [https://doi.org/10.1016/j.vaccine.2016.03.042] [PMID]
2. World Health Organization. Maternal Mortality [Fact Sheet]. Geneva: World Health Organization; 2023. [https://www.who.int/news-room/fact-sheets/detail/maternal-mortality]
3. Huang H, Ma J, Ling S, Han L, Jiang G, Xu W. Incidence and Disability-Adjusted Life Years of Maternal Disorders at the Global, Regional, and National Levels From 2007 to 2017: A Systematic Analysis for the Global Burden of Disease Study 2017. International Journal of Gynecology and Obstetrics. 2022;157(3):618-39. [https://doi.org/10.1002/ijgo.13889] [PMID]
4. Kubuka A, Abdulrahman H, Soa A, Kivishe P. Unsafe Abortion; The Hidden Cause of Maternal Death. International Journal of Family and Community Medicine. 2023;7(5):157-8. [https://doi.org/10.15406/ijfcm.2023.07.00331]
5. Araste A, Jafari E, Zenoozian S, Kharaghani R. Prevalence of Unplanned Pregnancy and Factors Related to Maternal-Fetal Attachment in Zanjan, 2017. Preventive Care in Nursing and Midwifery Journal. 2018;8(1):11-8. [https://doi.org/10.29252/pcnm.8.1.11]
6. Bearak J, Popinchalk A, Ganatra B, Moller A-B, Tunçalp Ö, Beavin C, et al. Unintended Pregnancy and Abortion by Income, Region, and the Legal Status of Abortion: Estimates From a Comprehensive Model for 1990-2019. The Lancet Global Health. 2020;8(9):e1152-61. [https://doi.org/10.1016/S2214-109X(20)30315-6] [PMID]
7. World Health Organization. Abortion [Fact Sheet]. Geneva: World Health Organization; 2021. [https://www.who.int/news-room/fact-sheets/detail/abortion]
8. Berg A. Abortion and Miscarriage. Philosophical Studies. 2017;174:1217-26. [https://doi.org/10.1007/s11098-016-0750-z]
9. Adler AJ, Filippi V, Thomas SL, Ronsmans C. Quantifying the Global Burden of Morbidity Due to Unsafe Abortion: Magnitude in Hospital‐Based Studies and Methodological Issues. International Journal of Gynecology and Obstetrics. 2012;118 Suppl:S65-77. [https://doi.org/10.1016/S0020-7292(12)60003-4] [PMID]
10. Raza S, Banik R, Noor STA, Jahan E, Sayeed A, Huq N, et al. Assessing Health Systems' Capacities to Provide Post-Abortion Care: Insights From Seven Low-and Middle-Income Countries. Journal of Global Health. 2025;15:04020. [https://doi.org/10.7189/jogh.15.04020] [PMID]
11. Aung EE, Liabsuetrakul T, Panichkriangkrai W, Makka N, Bundhamchareon K. Years of Healthy Life Lost Due to Adverse Pregnancy and Childbirth Outcomes Among Adolescent Mothers in Thailand. AIMS Public Health. 2018;5(4):463-76. [https://doi.org/10.3934/publichealth.2018.4.463] [PMID]
12. Musabwasoni S, Nyiringango G, Uwambaye P, Mukeshimana M, Ngoga E, Uhawenimana T, et al. Psychology of Abortion: A Qualitative Exploration of Women's Quality of Life After Termination of Pregnancy Service Provision. Rwanda Journal of Medicine and Health Sciences. 2024;7(1):116-30. [https://doi.org/10.4314/rjmhs.v7i1.9] [PMID]
13. Moore B, Poss C, Coast E, Lattof SR, van der Meulen Rodgers Y. The Economics of Abortion and Its Links With Stigma: A Secondary Analysis From a Scoping Review on the Economics of Abortion. PLoS One. 2021;16(2):e0246238. [https://doi.org/10.1371/journal.pone.0246238] [PMID]
14. Soleimani Movahed M, Barghazan SH, Askari F, Zozani MA. The Economic Burden of Abortion and Its Complication Treatment Cares: A Systematic Review. Journal of Family and Reproductive Health. 2020;14(2):60-7. [https://doi.org/10.18502/jfrh.v14i2.4354] [PMID]
15. Moradinazar M, Rostami R, Armaghan N, Shakiba M, Rai A, Abbasi Azizi S, et al. Epidemiological Features of Spontaneous Abortion in the North Africa and the Middle East From 1990 to 2019: Results From the Global Burden of Disease Study 2019. Journal of Family and Reproductive Health. 2022;16(3):183-91. [https://doi.org/10.18502/jfrh.v16i3.10579] [PMID]
16. Jolivet RR, Gausman J, Langer A. Measuring Social, Economic, Policy, and Health System Determinants of Maternal Health and Survival: An Urgent Global Priority. PLoS One. 2025;20(1):e0317095. [https://doi.org/10.1371/journal.pone.0317095] [PMID]
17. Moller AB, Patten JH, Hanson C, Morgan A, Say L, Diaz T, et al. Monitoring Maternal and Newborn Health Outcomes Globally: A Brief History of Key Events and Initiatives. Tropical Medicine and International Health. 2019;24(12):1342-68. [https://doi.org/10.1111/tmi.13313] [PMID]
18. Maternal Death - Definition and Classification. Cork, Ireland: National Perinatal Epidemiology Centre (NPEC), University College Cork; 2025. [https://www.ucc.ie/en/mde/definitionandclassificationofmaternaldeath/.]
19. Cresswell JA, Alexander M, Chong MY, Link HM, Pejchinovska M, Gazeley U, et al. Global and Regional Causes of Maternal Deaths 2009-20: A WHO Systematic Analysis. The Lancet Global Health. 2025;13(4):e626-34. [https://doi.org/10.1016/S2214-109X(24)00560-6] [PMID]
20. Sharma B, Smith R, Sharma BB, Pennell C. Maternal Mortality Ratios in Low-and Middle-Income Countries: A Comparison of Estimation Methods and Relationships With Sociodemographic Covariates. AJOG Global Reports. 2025;5(1):100438. [https://doi.org/10.1016/j.xagr.2024.100438] [PMID]
21. Ekwuazi EK, Chigbu CO, Ngene NC. Reducing Maternal Mortality in Low-and Middle-Income Countries. Case Reports in Women's Health. 2023;39:e00542. [https://doi.org/10.1016/j.crwh.2023.e00542] [PMID]
22. Olea-Ramirez LM, Leon-Larios F, Corrales-Gutierrez I. Intervention Strategies to Reduce Maternal Mortality in the Context of the Sustainable Development Goals: A Scoping Review. Women. 2024;4(4):387-405. [https://doi.org/10.3390/women4040030]
23. Wei Y, Luo H, Liu X, Sun G, Liu J, Wei X, et al. Global, Regional, and National Levels of Maternal Mortality, 1990-2021: A Systematic Analysis for the Global Burden of Disease Study 2021. BMC Pregnancy and Childbirth. 2025;25(1):1359. [https://doi.org/10.1186/s12884-025-08456-5] [PMID]
24. Tong F, Wang Y, Gao Q, Zhao Y, Zhang X, Li B, et al. The Epidemiology of Pregnancy Loss: Global Burden, Variable Risk Factors, and Predictions. Human Reproduction. 2024;39(4):834-48. [https://doi.org/10.1093/humrep/deae008] [PMID]
Send email to the article author
| Rights and permissions | |
 |
This work is licensed under a Creative Commons Attribution-NonCommercial 4.0 International License. |