
Preventive Care in Nursing and Midwifery Journal

Volume 15, Issue 1 (1-2025)
Prev Care Nurs Midwifery J 2025, 15(1): 56-66 |
Back to browse issues page


Ethics code: IR.ZUMS.REC.1401.212
Download citation:
BibTeX | RIS | EndNote | Medlars | ProCite | Reference Manager | RefWorks
Send citation to:


BibTeX | RIS | EndNote | Medlars | ProCite | Reference Manager | RefWorks
Send citation to:
Mohammadi Z, Fallah R, Khoshnevis Asl P, Ahmadi F. Effective factors on weight and height of two-year-old children: A longitudinal study using the joint quintile regression model. Prev Care Nurs Midwifery J 2025; 15 (1) :56-66
URL: http://nmcjournal.zums.ac.ir/article-1-967-en.html
URL: http://nmcjournal.zums.ac.ir/article-1-967-en.html


Department of Statistics and Epidemiology, School of Medicine, Zanjan University of Medical Sciences, Zanjan, Iran , ahmadi.farzan@gmail.com
Full-Text [PDF 932 kb]
(324 Downloads)
| Abstract (HTML) (536 Views)
Y ijk
For the τ-th ∈(0,1) quintile, the joint quintile function for Yijk denoted as (QYijk
Q Y ijk | u ij , v ik X ij , u ij , v ik )= X ij T β k + u ij + v ik
i =1,…, n , j =1, …, T , k =1, …, K
Whereu ij v ik u ij
In this method, random effects are considered as latent variables that must be estimated in step E of the EM algorithm. The MCEM algorithm has three steps: In step E, the mathematical expectation of the logarithm of the likelihood function is calculated. In this step, the mathematical expectation of the logarithm of the likelihood function is calculated using Metropolis-Hasting sampling for the latent variables ui
f Y ijk u ij , v ik , β k , X ij = τ (1- τ ) σ k exp - ρ τ Y ijk - X ij ' β k ( τ ) + u ij + v ik σ k
This method is particularly useful when the conditional distributions of these variables cannot be calculated analytically. In step M, the latent variables are replaced by their estimates, where the latent variablesU i V i
t - t +1 < β , u 2 v 2
In the bootstrap method, random samples of size n are selected from the data with replacement. A random sample is selected from X and Y and then based on the regression coefficients found, the residuals are calculated and at each iteration these residuals are added to the Y values and then the regression model is calculated at each sampling. If this is repeated B times, then a sequence of
β 1 , β 2 ,…, β B
The 2.5 and 97.5 percentiles from the bootstrap distribution were used to calculate the 95% CI for each regression coefficient. If this interval includes zero, it indicates that the effect of the independent variable on the corresponding response variable in the joint model is not statistically significant. The number of bootstrap resamples was set to 1000. This number was chosen based on commonly accepted standards in bootstrap methodology, as it generally provides sufficiently accurate and reliable confidence intervals while maintaining a reasonable computational cost. Data analysis was performed using R software, version 4.3.3.
Results
Among the 420 children studied, most were male (52.1%), urban residents (71.4%), had mothers with a diploma-level education (30%), and were exclusively breastfed for up to 6 months (56.2%) (Table 1).
Demographic characteristics of mothers are presented in Table 2.
Table 2. Description of Demographic Variables of Mothers
The mean, standard deviation, minimum, and maximum values of children’s weight and height measured at different months are reported in Table 3. As observed, there is considerable variation in weight and height at each measurement month.
Table 4. Results of Fitting the Joint Quantile Regression Model to Identify Factors Affecting Children’s Weight and Height
Knowledge Translation Statement
Audience: Pediatric nurses and community health planners.
Maternal education, gestational age, and rural residence significantly impact child growth. Target rural and less-educated mothers with growth monitoring, breastfeeding support, and prenatal care education.
Audience: Pediatric nurses and community health planners.
Maternal education, gestational age, and rural residence significantly impact child growth. Target rural and less-educated mothers with growth monitoring, breastfeeding support, and prenatal care education.
Full-Text: (84 Views)
Introduction
Early childhood is the most important stage of human development because mental and physical development occur during this time period. Undernutrition in this stage can have irreversible effects on children’s growth and educational performance [1]. Child growth is internationally recognized as the best global indicator of children's physical health, and several international goals, such as the World Health Assembly's Global Goals for 2025, include growth-related targets for stunting, wasting, and overweight among children [2]. Wasting and underweight are two key indicators of undernutrition in children [3]. Wasting reflects acute malnutrition, while underweight indicates both acute and chronic malnutrition [4]. Measuring a child's weight and height is an integral part of every physical examination. These parameters are essential for assessing nutritional status [5]. In general, there are two main causes of growth disorders: organic causes, such as diseases, or non-organic causes, such as inappropriate feeding practices, with malnutrition being a key factor [6] The findings of a study showed that about 11 percent of Iranian children under 5 years of age are underweight, and this condition has been reported in about 17 percent of children in the southern region [1]. One study in 2013 showed that the prevalence of stunting in children under 2 years old was 33.7% [7]. The World Health Organization (WHO) set a target for all countries to reduce the prevalence of stunting at birth by 40% by 2025 [8]. One study showed that a short length at birth was a determinant of stunting later in life[9]. Stunting may also increase the risk of experiencing developmental delays and contracting non-communicable diseases later in life [8].
In examining the factors influencing children’s growth, linear regression is commonly used. However, when the distribution of the dependent variable is not normal or there are outliers, linear regression can produce biased estimates. In such cases, quintile regression is preferred, as it examines the effect of independent variables across different points of the distribution, making it more robust to outliers [10-12].
Children’s height and weight indicators are measured at different months; in other words, we are dealing with longitudinal data for growth indicators. Moreover, in longitudinal studies, it is common to measure multiple response variables simultaneously (multivariate longitudinal studies). In regression models used in such studies, both the correlation of each response variable over time and the correlation between different response variables must be taken into account. Most previous studies on the relationship between feeding practices during infancy and childhood and the growth of infants and children have been conducted using cross-sectional data [13].
The study was a multivariate longitudinal analysis of children's height and weight using a quintile regression model to examine the factors affecting growth indices of two-year-old children. This approach allows identification of children with growth trajectories in the low and high quintiles, increasing the accuracy and validity of estimates accounting for unobserved random effects, which capture time dependence within subjects and correlation between multiple outcomes.
Objectives
The present study aimed to investigate the factors affecting the growth indices of two-year-old Iranian children, using this advanced modeling framework, which can improve early detection of at-risk groups and facilitate more effective health and nutrition interventions.
Methods
Study Design and Setting
This study was a retrospective longitudinal study that examined the height and weight growth information of 420 two-year-old children with medical records in Zanjan health centers during 2018-2019.
Participants
The sample consisted of two-year-old children whose weight and height information from birth to 2 years of age were fully documented in their records.
Sample Size
The sample size was determined based on a common rule of thumb for regression analyses. According to this guideline, for each independent variable in the model, which consists of 9 variables, between 10 and 20 samples are recommended. By estimating the number of 20 samples based on the number of independent variables in the model and considering two dependent variables, the required sample size would be at least 180 individuals. Considering two dependent variables, the total sample size was calculated to be 360 individuals. However, to increase the precision and generalizability of the model, the sample size was increased to 420 individuals.
This increase in sample size helps reduce the risk of over-fitting and ensure accurate estimates of regression coefficients.
Sampling Method
Sampling was conducted using a two-stage cluster method, and the health centers of Zanjan province were considered as one cluster. According to the calculated sample size, in the first stage, the clusters were divided into urban and rural groups. Then three centers were randomly selected from Zanjan city (urban) and three centers from rural areas. In the second stage, 100 people were randomly selected from each urban cluster and 40 people from each rural cluster.
This distribution of samples was done in order to more accurately compare the characteristics and health status of the two urban and rural groups. This approach takes advantage of the efficiency of two-stage cluster sampling, which is known for its practical advantages in field surveys, by reducing travel and operational costs while maintaining reasonable representativeness.
Variables
Two-year-old children whose weight and height information from birth to 2 years of age were fully documented in their records were included in the study. Key indicators such as height and weight, along with health information recorded in the Integrated Health System (IHS), including gender, place of residence, exclusive breastfeeding for six months, non-exclusive breastfeeding (breastfeeding with formula or other fluids before six months of age), maternal age, gestational age, maternal body mass index, and maternal education level, were considered as independent variables to simultaneously evaluate their effect on the dependent variables, children's height and weight.
Follow-up
Height and weight were measured for all children at seven time points: birth, 2, 4, 6, 12, 18, and 24 months, respectively.
Statistical Methods
After data entry into the software, descriptive descriptive statistics (frequency distribution tables, means, and standard deviations) were used to describe the data. Following initial analyses, in this study, due to the non-normal distribution of errors and the presence of outliers, the quintile regression model was used. Quintile regression enables the examination of the effect of independent variables on different quintiles of the distribution of the dependent variable. This method is more robust than least squares regression in dealing with non-normal data and variance heterogeneity, and prevents the effect of outlier observations. To perform the necessary inferences, it is required to estimate the regression coefficients for each dependent variable
( ) as well as the variances σ2vσ2u and σ2. These estimates were obtained using the Monte Carlo Expectation-Maximization (MCEM) algorithm, and the bootstrap method was employed to compute confidence intervals for the regression coefficients [11].
Let
For the τ-th ∈(0,1) quintile, the joint quintile function for Yijk denoted as (QYijk
Where
In this method, random effects are considered as latent variables that must be estimated in step E of the EM algorithm. The MCEM algorithm has three steps: In step E, the mathematical expectation of the logarithm of the likelihood function is calculated. In this step, the mathematical expectation of the logarithm of the likelihood function is calculated using Metropolis-Hasting sampling for the latent variables ui
This method is particularly useful when the conditional distributions of these variables cannot be calculated analytically. In step M, the latent variables are replaced by their estimates, where the latent variables
In the bootstrap method, random samples of size n are selected from the data with replacement. A random sample is selected from X and Y and then based on the regression coefficients found, the residuals are calculated and at each iteration these residuals are added to the Y values and then the regression model is calculated at each sampling. If this is repeated B times, then a sequence of
The 2.5 and 97.5 percentiles from the bootstrap distribution were used to calculate the 95% CI for each regression coefficient. If this interval includes zero, it indicates that the effect of the independent variable on the corresponding response variable in the joint model is not statistically significant. The number of bootstrap resamples was set to 1000. This number was chosen based on commonly accepted standards in bootstrap methodology, as it generally provides sufficiently accurate and reliable confidence intervals while maintaining a reasonable computational cost. Data analysis was performed using R software, version 4.3.3.
Results
Among the 420 children studied, most were male (52.1%), urban residents (71.4%), had mothers with a diploma-level education (30%), and were exclusively breastfed for up to 6 months (56.2%) (Table 1).
| % | n | Category | Variable |
| 47.9% | 201 | Female | Gender |
| 52.1% | 219 | Male | |
| 56.2% | 236 | Yes | Exclusive breastfeeding |
| 43.8% | 184 | No | |
| 71.4% | 300 | Urban | Place of residence |
| 28.6% | 120 | Rural | |
| 17.6% | 74 | Illiterate / Primary education | Mother’s education |
| 27.9% | 117 | Less than a high school diploma | |
| 30.0% | 126 | Diploma | |
| 24.5% | 103 | Bachelor’s and above |
Demographic characteristics of mothers are presented in Table 2.
Table 2. Description of Demographic Variables of Mothers
| SD | Mean | Maximum | Minimum | Variable |
| 1.66 | 38.30 | 42 | 27 | Gestational age |
| 4.22 | 26.55 | 38.39 | 16.72 | Body mass index |
| 6.44 | 30.70 | 49 | 17 | Age of mothers |
The mean, standard deviation, minimum, and maximum values of children’s weight and height measured at different months are reported in Table 3. As observed, there is considerable variation in weight and height at each measurement month.
| Minimum | Maximum | SD | Mean | Time Point | Variable |
| 5.20 | 1.80 | 0.53 | 3.35 | At birth | Weight |
| 7.50 | 2.90 | 0.70 | 5.32 | 2 month | |
| 9.20 | 3.90 | 0.83 | 6.82 | 4 month | |
| 11.00 | 4.30 | 0.96 | 7.80 | 6 month | |
| 14.50 | 6.00 | 1.14 | 9.54 | 12 month | |
| 19.00 | 7.50 | 1.32 | 10.99 | 18 month | |
| 22.00 | 8.70 | 1.38 | 12.31 | 24 month | |
| 60.00 | 41.00 | 2.30 | 50.23 | At birth | Height |
| 67.00 | 48.00 | 2.49 | 57.53 | 2 month | |
| 72.00 | 54.00 | 2.56 | 63.42 | 4 month | |
| 79.00 | 59.00 | 2.57 | 67.37 | 6 month | |
| 86.00 | 65.50 | 2.89 | 74.96 | 12 month | |
| 92.00 | 74.00 | 2.97 | 81.96 | 18 month | |
| 98.00 | 79.00 | 3.19 | 87.86 | 24 month |
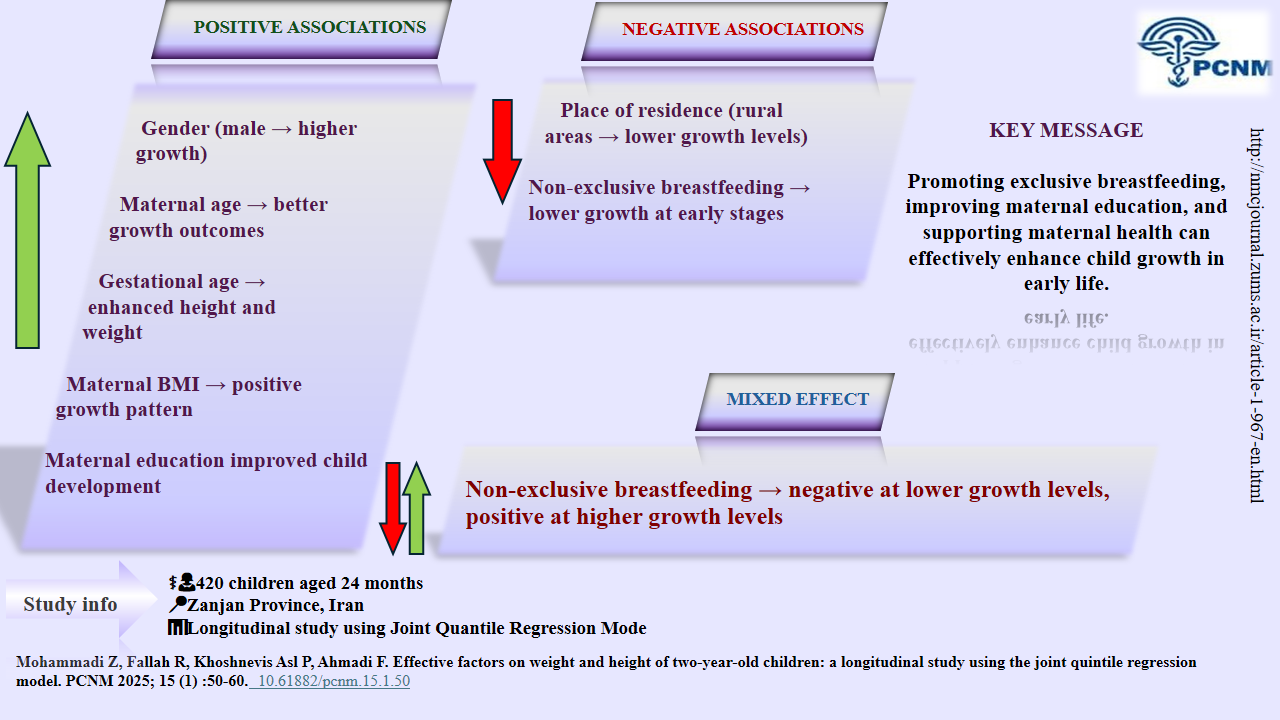
Table 4 presents the results of the joint quintile regression model for weight and height across the 0.03, 0.25, 0.50, 0.75, and 0.97 quintiles. The effects of gender, maternal age, residence, gestational age, maternal BMI, breastfeeding, and maternal education were statistically significant for both outcomes, except for maternal diploma education at the 0.25 quintile of height, which was not significant [95% CI: −0.05, 0.03]. The effect of gender increased from lower to higher quintiles. For example, at the median (Q0.50), boys had 0.53 kg (95% CI: 0.53–0.55) higher weight and 1.50 cm (95% CI: 1.48–1.52) greater height than girls. Maternal age had a positive but modest association with growth, with weight increasing by approximately 7.1×10⁻³ kg per year at Q0.50 (95% CI: 6.1×10⁻³–7.3×10⁻³) and height by 0.02 cm (95% CI: 0.02–0.03). Residence showed an inverse relationship; children living in rural areas had lower weight (Q0.50: −0.11 kg) and height (Q0.50: −0.32 cm, 95% CI: −0.36 to −0.28) compared with their urban counterparts. Gestational age was positively associated with both weight and height, with stronger effects in lower quintiles of height (Q0.03: +0.62 cm) compared with upper quintiles (Q0.97: +0.36 cm). Maternal BMI was also positively related to weight, with the effect being most evident at higher quintiles (Q0.97: +0.02 kg, 95% CI: 0.01–0.02). Non-exclusive breastfeeding hurt weight at all quintiles (e.g., Q0.50: −0.03 kg, 95% CI: −0.04 to −0.03) and on height in most quintiles, except for Q0.75 (B=+0.36 cm, 95% CI: 0.33–0.40) and Q0.97, where the effect turned positive. Finally, higher maternal education (middle/high school and university) was positively associated with weight and height, while diploma education at Q0.25 of height showed no significant effect.
Table 4. Results of Fitting the Joint Quantile Regression Model to Identify Factors Affecting Children’s Weight and Height
| Dependent Variable | Independent Variable | Quantile | β [95% CI] |
| Weight | Gender (Ref: Girl) | 0.03 | 0.44 [0.43, 0.46] |
| 0.25 | 0.57 [0.57, 0.58] | ||
| 0.50 | 0.53 [0.53, 0.55] | ||
| 0.75 | 0.52 [0.52, 0.53] | ||
| 0.97 | 0.65 [0.64, 0.65] | ||
| Height | Gender (Ref: Girl) | 0.03 | 0.88 [0.90, 0.91] |
| 0.25 | 1.27 [1.25, 1.30] | ||
| 0.50 | 1.50 [1.48, 1.52] | ||
| 0.75 | 1.15 [1.12, 1.19] | ||
| 0.97 | 1.19 [1.18, 1.20] | ||
| Weight | Mother's age | 0.03 | 0.01 [0.01, 0.02] |
| 0.25 | 0.01 [0.01, 0.01] | ||
| 0.50 | 0.02 [0.02, 0.03] | ||
| 0.75 | 0.02 [0.01, 0.03] | ||
| 0.97 | 0.02 [0.02, 0.03] | ||
| Height | Mother's age | 0.03 | 0.01 [0.01, 0.01] |
| 0.25 | 7.90×10³ [7.90×10³, 8.30×10³] | ||
| 0.50 | 0.02 [0.02, 0.03] | ||
| 0.75 | 0.01 [0.01, 0.02] | ||
| 0.97 | 0.04 [0.04, 0.05] | ||
| Weight | Residence (Ref: Urban) | 0.03 | -0.13 [-0.13, -0.12] |
| 0.25 | -0.11 [-0.11, -0.12] | ||
| 0.50 | -0.11 [-0.11, -0.10] | ||
| 0.75 | -0.13 [-0.13, -0.14] | ||
| 0.97 | -0.16 [-0.16, -0.16] | ||
| Height | Residence (Ref: Urban) | 0.03 | -0.36 [-0.46, -0.44] |
| 0.25 | -1.04 [-1.07, -1.01] | ||
| 0.50 | -0.32 [-0.36, -0.28] | ||
| 0.75 | -0.22 [-0.26, -0.17] | ||
| 0.97 | -0.39 [-0.39, -0.36] | ||
| Weight | Gestational age | 0.03 | 0.16 [0.16, 0.17] |
| 0.25 | 0.15 [0.15, 0.16] | ||
| 0.50 | 0.14 [0.14, 0.16] | ||
| 0.75 | 0.14 [0.15, 0.16] | ||
| 0.97 | 0.15 [0.15, 0.16] | ||
| Height | Gestational age | 0.03 | 0.62 [0.62, 0.63] |
| 0.25 | 0.59 [0.59, 0.60] | ||
| 0.50 | 0.45 [0.44, 0.46] | ||
| 0.75 | 0.36 [0.35, 0.38] | ||
| 0.97 | 0.36 [0.35, 0.37] |
BMI = Body Mass Index. Reference categories: Gender: Girl; Place of residence: Urban; Infant feeding: Exclusive breastfeeding; Education: Illiterate/Primary school. The table presents beta coefficients (β) and 95% confidence intervals (CI) from the joint quantile regression model across different quantiles (0.03, 0.25, 0.50, 0.75, 0.97).
Table 5 shows the variance estimates of the random factors (u and v). The relatively high values of U (ranging from 8.47 at Q0.03 to 9.41 at Q0.75) indicate strong variability in children’s height and weight across time and quintiles. The non-zero values of v confirm that modeling the correlation between height and weight was appropriate. Notably, v reached its maximum at the 0.97 quintile (0.99), suggesting a stronger interdependence between height and weight in children at the upper tail of the growth distribution. These findings highlight that growth is a dynamic and time-dependent process, and ignoring temporal changes would lead to an incomplete understanding of growth trajectories.
Table 5. Estimates of Variance Components U and V in the Multivariate Quantile Regression Model
Discussion
In this study, using the quintile regression model, the factors affecting children's growth indices were investigated. According to the findings, based on the quintile regression, all variables were in some way related to growth indices (height and weight). In the lower quintiles, the intensity of the association between weights in boys, maternal age, university education, and gestational age was significantly higher and positive than the other variables, but children who were not exclusively breastfed showed weight loss in all quintiles compared to children who were exclusively breastfed. In the higher quintiles, the intensity of the association between weight in boys, maternal age, gestational age, body mass index, and higher university education was significantly higher and positive. Also, in the lower quintiles, the intensity of the association between height in boys, maternal age, and university and secondary education of the mother was significantly higher and positive. However, children who were not exclusively breastfed had a decrease in height compared to children who were exclusively breastfed. In higher quintiles, the strength of the relationship between height in boys, maternal age, gestational age, university education, and body mass index was significantly higher and positive. Also, at some quintiles, children who were not exclusively breastfed had an increase in height compared to children who were exclusively breastfed. Then, living in a rural area hurt the growth (height and weight) of children compared to city residents. It can be further said that in all quintiles, the growth of height and weight of boys was greater compared to girls. The quintiles 0.03, 0.25, 0.50, 0.75, 0.97 were selected based on comparisons of weight, height, or BMI data with standard reference populations developed by the World Health Organization (WHO) to identify the normal growth pattern and possible deviations from it over time. In these graphs, the different quintiles indicate the child's developmental position compared to other children of the same age and sex. Quintiles below 3 indicate short stature or low weight. The median quintile represents the normal or "average" growth rate of the reference population; that is, half of the children fall above and half below this point. A child's consistent and consistent placement around the median is a sign of healthy and balanced growth; While sudden changes can be a warning sign of nutritional or growth problems, children whose weight and height fall within the 3rd to 97th quintile range are considered to be growing normally, and quintiles above 97 indicate overweight or obesity [14]. On the other hand, underweight is defined as a child whose weight-for-age ratio is less than -2 standard deviations (SD) from the median of the World Health Organization child growth standards, which indicates acute and chronic malnutrition. The same applies to short stature. Weight gain is more than +2 standard deviations from the median of the growth standards, which may be due to excessive calorie intake or lack of physical activity [4].
Gender significantly influenced growth, influencing child growth measures, with boys showing a stronger and more direct association with height and weight gain than girls. This finding is consistent with the findings of Al-Mazrou et al. in Saudi Arabia [14]. The study by Atarodi et al. was also in agreement with the results of the present study [15]. However, in the study by Vahabi et al., gender did not show a significant relationship with the child's growth process [16].
Child development can depend on factors other than gender, such as genetics, environment, and interactions with male and female children. The results of the present study showed that non-exclusive breastfeeding was also significantly associated with children's height and weight compared to exclusive breastfeeding. In some of the lower quintiles for height and in almost all quintiles for weight, except the 0.25 quintile, this relationship was inverse. This finding aligns with the results of the study by Gohari and colleagues, who investigated factors affecting children’s growth. They concluded that discontinuing exclusive breastfeeding leads to weight loss in children, and without appropriate complementary foods alongside breastfeeding, this contributes to weight reduction [17]. Also, Mohammad Beigi et al. confirmed the effect of exclusive breastfeeding on children's growth [18]. Therefore, exclusive breastfeeding requires careful attention, and necessary education should be provided to mothers.
However, the study by Ebrahimzadeh et al. in Khorramabad city was not in line with the results of the present study [19]. It can be said that using formula and appropriate supplements does not interfere with a child's development compared to exclusive breastfeeding. Also, the positive effect of non-exclusive nutrition on the upper quantiles of children's height may be due to nutritional supplements in high-income families or genetic factors. Therefore, it can be concluded that mothers with higher education, due to their greater knowledge and better child care practices, can play an important role in child development. The study by Rezaeizadeh et al. was a systematic review and meta-analysis that found that a high level of maternal education positively affected child development from birth to two years of age. This result was consistent with the results of the present study [20]. Also, the results of Manouchehri et al.'s study on the association between low weight in children under two years of age and low maternal education were consistent with the present study [21]. In a study conducted in 2025 by Hjertholm et al., it was found that maternal age and education affected on the child's weight during the first six months, which was consistent with the results of the present study [22]. In the study by Hyun Yu et al., maternal age also affected child growth, which was consistent with the results of the present study [23]. Maternal BMI (mean: 26.55) showed significant correlation and a small effect with child height and weight in all quintiles, which was consistent with the results of the study by Hosseinzadeh et al.[24]. It can be stated that if mothers have an appropriate health status and weight, they can play an important role in the growth process of their child The maternal gestational age, with an average of 38 weeks, showed a significant and direct relationship with height and weight, indicating that due to better and more complete development of children in the last months of pregnancy, if the mother's conditions permit, delivery after 39 weeks is preferable. According to the results of the study by Hokken-Koelega and colleagues, mothers who had a low gestational age affected the growth indicators of children from birth to adulthood [25]. Furthermore, the results of Kimberly A. Hochstedler's study supported these findings [26].
Being a rural resident, compared to living in urban areas, had a significant but inverse relationship with children's height and weight. The study by Shahsavari et al. was consistent with the results of the present study [27]. Additionally, Manouchehri's study found a significant relationship between place of residence and wasting in one- to two-year-old children, which further supports the findings of the present study [28].
This also emphasizes the need for special attention to rural children. However, the study by Ahmadi et al. did not confirm these results. This difference in urban and rural areas is partly due to differences in the level of development of these areas [29]. It may have been conducted in an area where rural residents had better and faster access to urban services, or the demographic and economic structure of the sample may have been different. It may also have used different instruments or definitions, leading to different results compared to the present study and other studies. Given the very high correlation between children's height and weight and the correlation between observations in different months, measuring height and weight using joint quintile regression was the most appropriate model to use. Despite the use of longitudinal modeling in the data analysis of this study, the most important limitation of this research was the retrospective nature of the study and, as a result, the inability to control for some confounding variables during design and implementation. Given the aforementioned limitations, it is suggested that future cohort studies be conducted on urban and rural children to identify different risk factors and that all direct and indirect risk factors for child development be examined simultaneously in a single study to control for the interaction of factors. Using the proposed model to analyze infant growth data in Zanjan may have limited generalizability to other populations in different cities. To achieve better statistical power to detect significant differences, a larger sample size is needed. Due to the complexities of the quintile regression model with random effects and asymmetric Laplace distribution, it was not possible to calculate the power of the test with analytical formulas. However, a sample size of 420 children with 7 measurements for each was considered statistically and empirically appropriate. Also, due to software limitations and computational resources, sensitivity analysis using standard quintiles (0.05, 0.25, 0.5, 0.75, 0.97) was not possible. Instead, the bootstrap method was used to assess the stability of the results. In addition, due to the structural complexity of the model and unobserved random effects, interaction tests between coefficients in different quintiles (such as the Wald test) were not performed. As a result, statistical comparisons of coefficients across quintiles were not performed due to computational limitations. Overall, given the complexities of the model and resource constraints, these approaches were considered as suitable alternatives. In future studies, as more computational resources become available, it will be possible to perform more detailed and comprehensive analyses.
Conclusion
According to the results of this study, all variables had a significant relationship with child growth, but it seems that mothers with higher education have a much greater impact on child growth compared to illiterate mothers or mothers with only primary education. Gestational age can also have an important impact on child growth. In addition, living in a rural area hurt children's height and weight growth compared to living in an urban area. Therefore, empowering less educated and rural mothers with appropriate knowledge and skills for child growth could be the most important factor affecting children's height and weight indicators. However, these effects alone cannot explain all aspects of child growth. Future research should investigate the intricate relationships between socioeconomic, environmental, and maternal characteristics to gain a more comprehensive understanding of their impact on child growth.
Ethical Considerations
The institutional review board of Zanjan University of Medical Sciences approved the protocol of the study (ethics code: IR.ZUMS.REC.1401.212). The participants' privacy was preserved. Also, all methods were carried out according to relevant guidelines and regulations.
Acknowledgments
This study is based on the master's thesis entitled "Application of the Joint Quintile Regression Model in the Analysis of Multivariate Longitudinal Data Obtained from Anthropometric Indicators of Children under Two Years of Age." I would like to express my deepest gratitude to my best friend, Samira Ahmadi, for her invaluable assistance in the writing of the article.
Conflict of Interest
The authors declare that there is no conflict of interest.
Funding
There was no funding or support.
Authors' Contributions
Mohammadi Z., Fallah R., Khoshnevisasl P., and Ahmadi F. contributed to data analysis and manuscript preparation. All authors read and approved the final manuscript.
Artificial Intelligence Utilization
The authors declare that no generative AI technologies were used in the creation of this manuscript.
Data Availability Statement
The datasets generated and/or analyzed during the current study are available from the corresponding author upon reasonable request.
Table 5 shows the variance estimates of the random factors (u and v). The relatively high values of U (ranging from 8.47 at Q0.03 to 9.41 at Q0.75) indicate strong variability in children’s height and weight across time and quintiles. The non-zero values of v confirm that modeling the correlation between height and weight was appropriate. Notably, v reached its maximum at the 0.97 quintile (0.99), suggesting a stronger interdependence between height and weight in children at the upper tail of the growth distribution. These findings highlight that growth is a dynamic and time-dependent process, and ignoring temporal changes would lead to an incomplete understanding of growth trajectories.
Table 5. Estimates of Variance Components U and V in the Multivariate Quantile Regression Model
| Quantile | ||
| 8.47 | 0.06 | 0.03 |
| 9.38 | 0.04 | 0.25 |
| 9.35 | 0.04 | 0.50 |
| 9.41 | 0.05 | 0.75 |
| 8.86 | 0.99 | 0.97 |
Discussion
In this study, using the quintile regression model, the factors affecting children's growth indices were investigated. According to the findings, based on the quintile regression, all variables were in some way related to growth indices (height and weight). In the lower quintiles, the intensity of the association between weights in boys, maternal age, university education, and gestational age was significantly higher and positive than the other variables, but children who were not exclusively breastfed showed weight loss in all quintiles compared to children who were exclusively breastfed. In the higher quintiles, the intensity of the association between weight in boys, maternal age, gestational age, body mass index, and higher university education was significantly higher and positive. Also, in the lower quintiles, the intensity of the association between height in boys, maternal age, and university and secondary education of the mother was significantly higher and positive. However, children who were not exclusively breastfed had a decrease in height compared to children who were exclusively breastfed. In higher quintiles, the strength of the relationship between height in boys, maternal age, gestational age, university education, and body mass index was significantly higher and positive. Also, at some quintiles, children who were not exclusively breastfed had an increase in height compared to children who were exclusively breastfed. Then, living in a rural area hurt the growth (height and weight) of children compared to city residents. It can be further said that in all quintiles, the growth of height and weight of boys was greater compared to girls. The quintiles 0.03, 0.25, 0.50, 0.75, 0.97 were selected based on comparisons of weight, height, or BMI data with standard reference populations developed by the World Health Organization (WHO) to identify the normal growth pattern and possible deviations from it over time. In these graphs, the different quintiles indicate the child's developmental position compared to other children of the same age and sex. Quintiles below 3 indicate short stature or low weight. The median quintile represents the normal or "average" growth rate of the reference population; that is, half of the children fall above and half below this point. A child's consistent and consistent placement around the median is a sign of healthy and balanced growth; While sudden changes can be a warning sign of nutritional or growth problems, children whose weight and height fall within the 3rd to 97th quintile range are considered to be growing normally, and quintiles above 97 indicate overweight or obesity [14]. On the other hand, underweight is defined as a child whose weight-for-age ratio is less than -2 standard deviations (SD) from the median of the World Health Organization child growth standards, which indicates acute and chronic malnutrition. The same applies to short stature. Weight gain is more than +2 standard deviations from the median of the growth standards, which may be due to excessive calorie intake or lack of physical activity [4].
Gender significantly influenced growth, influencing child growth measures, with boys showing a stronger and more direct association with height and weight gain than girls. This finding is consistent with the findings of Al-Mazrou et al. in Saudi Arabia [14]. The study by Atarodi et al. was also in agreement with the results of the present study [15]. However, in the study by Vahabi et al., gender did not show a significant relationship with the child's growth process [16].
Child development can depend on factors other than gender, such as genetics, environment, and interactions with male and female children. The results of the present study showed that non-exclusive breastfeeding was also significantly associated with children's height and weight compared to exclusive breastfeeding. In some of the lower quintiles for height and in almost all quintiles for weight, except the 0.25 quintile, this relationship was inverse. This finding aligns with the results of the study by Gohari and colleagues, who investigated factors affecting children’s growth. They concluded that discontinuing exclusive breastfeeding leads to weight loss in children, and without appropriate complementary foods alongside breastfeeding, this contributes to weight reduction [17]. Also, Mohammad Beigi et al. confirmed the effect of exclusive breastfeeding on children's growth [18]. Therefore, exclusive breastfeeding requires careful attention, and necessary education should be provided to mothers.
However, the study by Ebrahimzadeh et al. in Khorramabad city was not in line with the results of the present study [19]. It can be said that using formula and appropriate supplements does not interfere with a child's development compared to exclusive breastfeeding. Also, the positive effect of non-exclusive nutrition on the upper quantiles of children's height may be due to nutritional supplements in high-income families or genetic factors. Therefore, it can be concluded that mothers with higher education, due to their greater knowledge and better child care practices, can play an important role in child development. The study by Rezaeizadeh et al. was a systematic review and meta-analysis that found that a high level of maternal education positively affected child development from birth to two years of age. This result was consistent with the results of the present study [20]. Also, the results of Manouchehri et al.'s study on the association between low weight in children under two years of age and low maternal education were consistent with the present study [21]. In a study conducted in 2025 by Hjertholm et al., it was found that maternal age and education affected on the child's weight during the first six months, which was consistent with the results of the present study [22]. In the study by Hyun Yu et al., maternal age also affected child growth, which was consistent with the results of the present study [23]. Maternal BMI (mean: 26.55) showed significant correlation and a small effect with child height and weight in all quintiles, which was consistent with the results of the study by Hosseinzadeh et al.[24]. It can be stated that if mothers have an appropriate health status and weight, they can play an important role in the growth process of their child The maternal gestational age, with an average of 38 weeks, showed a significant and direct relationship with height and weight, indicating that due to better and more complete development of children in the last months of pregnancy, if the mother's conditions permit, delivery after 39 weeks is preferable. According to the results of the study by Hokken-Koelega and colleagues, mothers who had a low gestational age affected the growth indicators of children from birth to adulthood [25]. Furthermore, the results of Kimberly A. Hochstedler's study supported these findings [26].
Being a rural resident, compared to living in urban areas, had a significant but inverse relationship with children's height and weight. The study by Shahsavari et al. was consistent with the results of the present study [27]. Additionally, Manouchehri's study found a significant relationship between place of residence and wasting in one- to two-year-old children, which further supports the findings of the present study [28].
This also emphasizes the need for special attention to rural children. However, the study by Ahmadi et al. did not confirm these results. This difference in urban and rural areas is partly due to differences in the level of development of these areas [29]. It may have been conducted in an area where rural residents had better and faster access to urban services, or the demographic and economic structure of the sample may have been different. It may also have used different instruments or definitions, leading to different results compared to the present study and other studies. Given the very high correlation between children's height and weight and the correlation between observations in different months, measuring height and weight using joint quintile regression was the most appropriate model to use. Despite the use of longitudinal modeling in the data analysis of this study, the most important limitation of this research was the retrospective nature of the study and, as a result, the inability to control for some confounding variables during design and implementation. Given the aforementioned limitations, it is suggested that future cohort studies be conducted on urban and rural children to identify different risk factors and that all direct and indirect risk factors for child development be examined simultaneously in a single study to control for the interaction of factors. Using the proposed model to analyze infant growth data in Zanjan may have limited generalizability to other populations in different cities. To achieve better statistical power to detect significant differences, a larger sample size is needed. Due to the complexities of the quintile regression model with random effects and asymmetric Laplace distribution, it was not possible to calculate the power of the test with analytical formulas. However, a sample size of 420 children with 7 measurements for each was considered statistically and empirically appropriate. Also, due to software limitations and computational resources, sensitivity analysis using standard quintiles (0.05, 0.25, 0.5, 0.75, 0.97) was not possible. Instead, the bootstrap method was used to assess the stability of the results. In addition, due to the structural complexity of the model and unobserved random effects, interaction tests between coefficients in different quintiles (such as the Wald test) were not performed. As a result, statistical comparisons of coefficients across quintiles were not performed due to computational limitations. Overall, given the complexities of the model and resource constraints, these approaches were considered as suitable alternatives. In future studies, as more computational resources become available, it will be possible to perform more detailed and comprehensive analyses.
Conclusion
According to the results of this study, all variables had a significant relationship with child growth, but it seems that mothers with higher education have a much greater impact on child growth compared to illiterate mothers or mothers with only primary education. Gestational age can also have an important impact on child growth. In addition, living in a rural area hurt children's height and weight growth compared to living in an urban area. Therefore, empowering less educated and rural mothers with appropriate knowledge and skills for child growth could be the most important factor affecting children's height and weight indicators. However, these effects alone cannot explain all aspects of child growth. Future research should investigate the intricate relationships between socioeconomic, environmental, and maternal characteristics to gain a more comprehensive understanding of their impact on child growth.
Ethical Considerations
The institutional review board of Zanjan University of Medical Sciences approved the protocol of the study (ethics code: IR.ZUMS.REC.1401.212). The participants' privacy was preserved. Also, all methods were carried out according to relevant guidelines and regulations.
Acknowledgments
This study is based on the master's thesis entitled "Application of the Joint Quintile Regression Model in the Analysis of Multivariate Longitudinal Data Obtained from Anthropometric Indicators of Children under Two Years of Age." I would like to express my deepest gratitude to my best friend, Samira Ahmadi, for her invaluable assistance in the writing of the article.
Conflict of Interest
The authors declare that there is no conflict of interest.
Funding
There was no funding or support.
Authors' Contributions
Mohammadi Z., Fallah R., Khoshnevisasl P., and Ahmadi F. contributed to data analysis and manuscript preparation. All authors read and approved the final manuscript.
Artificial Intelligence Utilization
The authors declare that no generative AI technologies were used in the creation of this manuscript.
Data Availability Statement
The datasets generated and/or analyzed during the current study are available from the corresponding author upon reasonable request.
Type of Study: Orginal research |
Subject:
other
References
1. Moradi Y, Shadmani FK, Mansori K, Hanis SM, Khateri R, Mirzaei H. Prevalence of underweight and wasting in Iranian children aged below 5 years: a systematic review and meta-analysis. Korean Journal of Pediatrics. 2018;61(8):231. [https://doi.org/10.3345/kjp.2018.61.8.231] [PMID]
2. De Onis M. Child growth and development. Nutrition and Health in a Developing World. 2017:119-41. [https://doi.org/10.1007/978-3-319-43739-2_6]
3. Ngwira A, Munthali EC, Vwalika KD. Analysis on the association among stunting, wasting and underweight in Malawi: an application of a log-linear model for the three-way table. Journal of Public Health in Africa. 2017;8(1):620. [https://doi.org/10.4081/jphia.2017.620] [PMID]
4. Bekele T, Rahman B, Rawstorne P. The effect of access to water, sanitation and handwashing facilities on child growth indicators: Evidence from the Ethiopia Demographic and Health Survey 2016. PLOS One. 2020;15(9):e0239313. [https://doi.org/10.1371/journal.pone.0239313] [PMID]
5. Hägglund G, Andersson S, Düppe H, Pedertsen HL, Nordmark E, Westbom L. Prevention of severe contractures might replace multilevel surgery in cerebral palsy: results of a population-based health care programme and new techniques to reduce spasticity. Journal of Pediatric Orthopaedics B. 2005;14(4):269-73. [https://doi.org/10.1097/01202412-200507000-00007] [PMID]
6. Pourali S, Khorshodian N, Avazpour M, Malekzadeh J. An analytical study of complementary feeding pattern among healthy and failure to thrive children in Boyer-Ahmad County: A matched case-control study. Armaghane-Danesh. 2021;26(5):815-26. [https://doi.org/10.52547/armaghanj.26.5.815]
7. Titaley CR, Ariawan I, Hapsari D, Muasyaroh A, Dibley MJ. Determinants of the stunting of children under two years old in Indonesia: A multilevel analysis of the 2013 Indonesia basic health survey. Nutrients. 2019;11(5):1106. [https://doi.org/10.3390/nu11051106] [PMID]
8. Barker DJ, Osmond C, Kajantie E, Eriksson JG. Growth and chronic disease: findings in the Helsinki Birth Cohort. Annals of Human Biology. 2009;36(5):445-58. [https://doi.org/10.1080/03014460902980295] [PMID]
9. Beal T, Tumilowicz A, Sutrisna A, Izwardy D, Neufeld LM. A review of child stunting determinants in Indonesia. Maternal and Child Nutrition. 2018;14(4):e12617. [https://doi.org/10.1111/mcn.12617] [PMID]
10. Alfo M, Marino MF, Ranalli MG, Salvati N, Tzavidis N. M-quantile regression for multivariate longitudinal data: analysis of the Millennium Cohort Study data. ArXiv Preprint. 2016;1612.08114. [https://doi.org/10.48550/arXiv.1612.08114]
11. Kulkarni H, Biswas J, Das K. A joint quantile regression model for multiple longitudinal outcomes. ASTA Advances in Statistical Analysis. 2019;103:453-73. [https://doi.org/10.1007/s10182-018-00339-9]
12. Staffa SJ, Kohane DS, Zurakowski D. Quantile regression and its applications: a primer for anesthesiologists. Anesthesia and Analgesia. 2019;128(4):820-30. [https://doi.org/10.1213/ANE.0000000000004017] [PMID]
13. Nurrizka RH, Wenny DM, Amalia R. Complementary feeding practices and influencing factors among children under 2 years of age: a cross-sectional study in Indonesia. Pediatric Gastroenterology, Hepatology and Nutrition. 2021;24(6):535. [https://doi.org/10.5223/pghn.2021.24.6.535] [PMID]
14. Al-Mazrou Y, Al-Amood MM, Khoja T, Al-Turki K, El-Gizouli SE, Tantawi N, et al. Standardized national growth chart of 0-5 year-old Saudi children. Journal of Tropical Pediatrics. 2000;46(4):212-7. [https://doi.org/10.1093/tropej/46.4.212] [PMID]
15. Atarodi F, Mousavinasab N, Zamanfar D, Fallah R, Moadikhah S, Moadikhah S. Unraveling growth: analyzing the key factors influencing growth rate of children under two years. Journal of Biostatistics and Epidemiology. 2024. [https://doi.org/10.18502/jbe.v10i4.18523]
16. Vahabi N, Zayeri F, Moghadam EF, Safari M, Ebrahimzadeh F. Assessing the factors affecting height and weight trends among children under two years of age in Khorramabad: an application of marginal modeling. Iranian Journal of Epidemiology. 2015;11. [https://sid.ir/paper/120693/en]
17. Gohari MR, Zaeri F, Moghdamifard Z, Kholdi N, Vahabi N. Application of random effect model for determining factors affecting FTT in less than 2 years children in east of Tehran. Razi Journal of Medical Sciences. 2012:32-9. [http://rjms.iums.ac.ir/article-1-2201-fa.html.]
18. Mohammadbeigi A, Bayati A, Masoumi N, Soltani M. Effect of maternal breastfeeding on growth pattern of less than 6 month sucklings. Journal of Jahrom University of Medical Sciences. 2022;7(1):37-44. [https://doi.org/10.29252/jmj.7.1.2.37]
19. Ebrahimzadeh FH, Shadmehr A, Vahabi N, Fazeli Moghadam E, Naserian J, Safari M. Application of a marginal model for assessing some determinants of height and weight growth among children less than two years old in Khorramabad. Arak Medical University Journal. 2016;18(10). [http://jams.arakmu.ac.ir/article-1-3629-en.html.]
20. Rezaeizadeh G, Mansournia MA, Keshtkar A, Farahani Z, Zarepour F, Sharafkhah M, et al. Maternal education and its influence on child growth and nutritional status during the first two years of life: a systematic review and meta-analysis. EClinicalMedicine. 2024;71. [https://doi.org/10.1016/j.eclinm.2024.102574] [PMID]
21. Manoochehri S, Faradmal J, Poorolajal J, Asadi FT, Soltanian AR. Risk factors associated with underweight in children aged one to two years: a longitudinal study. BMC Public Health. 2024;24(1):1875. [https://doi.org/10.1186/s12889-024-19147-9] [PMID]
22. Hjertholm KG, Iversen PO, Holmboe-Ottesen G, Jepsen R. Risk factors for undernutrition and poor growth during the first 6 months of life in sub-Saharan Africa: a scoping review. Clinical Nutrition ESPEN. 2025. [https://doi.org/10.1016/j.clnesp.2025.05.019] [PMID]
23. Yu SH, Mason J, Crum J, Cappa C, Hotchkiss DR. Differential effects of young maternal age on child growth. Global Health Action. 2016;9(1):31171. [https://doi.org/10.3402/gha.v9.31171] [PMID]
24. Hosseinzadeh Z, Jashni Motlagh A, Biglarian A. Application of quantile regression to identify risk factors in infant growth parameters, private and social security hospitals in Tehran. Razi Journal of Medical Sciences. 2018;24(165):85-95. [https://sid.ir/paper/11059/fa.]
25. Hokken-Koelega AC, van der Steen M, Boguszewski MC, Cianfarani S, Dahlgren J, Horikawa R, et al. International consensus guideline on small for gestational age: etiology and management from infancy to early adulthood. Endocrine Reviews. 2023;44(3):539-65. [https://doi.org/10.1210/endrev/bnad002] [PMID]
26. Hochstedler KA, Bell G, Park H, Ghassabian A, Bell EM, Sundaram R, et al. Gestational age at birth and risk of developmental delay: the Upstate KIDS study. American Journal of Perinatology. 2021;38(10):1088-95. [https://doi.org/10.1055/s-0040-1702937] [PMID]
27. Shahsavari S, Zayeri F, Roshani D. Application of transition and marginalized transition longitudinal models for determining factors affecting FTT in children under 2 years in Tarom. Daneshvar Medicine. 2017;25(1):31-8.
28. Manoochehri S, Manoochehri Z, Asadi FT, Soltanian AR. A multilevel analysis of factors associated with wasting in children one to two years old in Hamadan city. Scientific Reports. 2024;14(1):28553. [https://doi.org/10.1038/s41598-024-75535-6] [PMID]
29. Ahmadi N, Salarilak S, Karamiar M, Khalkhali H. Survey of risk factors for failure to thrive among children less than one year age in Salmas district. Urmia Medical Journal. 2012. [http://umj.umsu.ac.ir/article-1-1175-en.html]
Send email to the article author
| Rights and permissions | |
 |
This work is licensed under a Creative Commons Attribution-NonCommercial 4.0 International License. |